“The trend is your friend until the end when it bends.”
Over the last several years, U.S. growth stocks, U.S. stocks with strong price momentum, and Bitcoin have been the best performing financial assets.
November marked a stalling of the performance trends for these assets. Is it the end of the trend? We don’t know.
We observe there was no market panic due to a big event like the Liberation Day tariff announcement or the arrival of the COVID-19 pandemic to explain the change in trend.
We do know the markets don’t ring a bell at the top.
We know U.S. growth stocks embed high expectations as evidenced by their high valuation multiples. We know flows in spot bitcoin ETFs turned negative November.
In hindsight, we will discover whether November marked the end of the outperformance trend for growth, momentum, and Bitcoin.
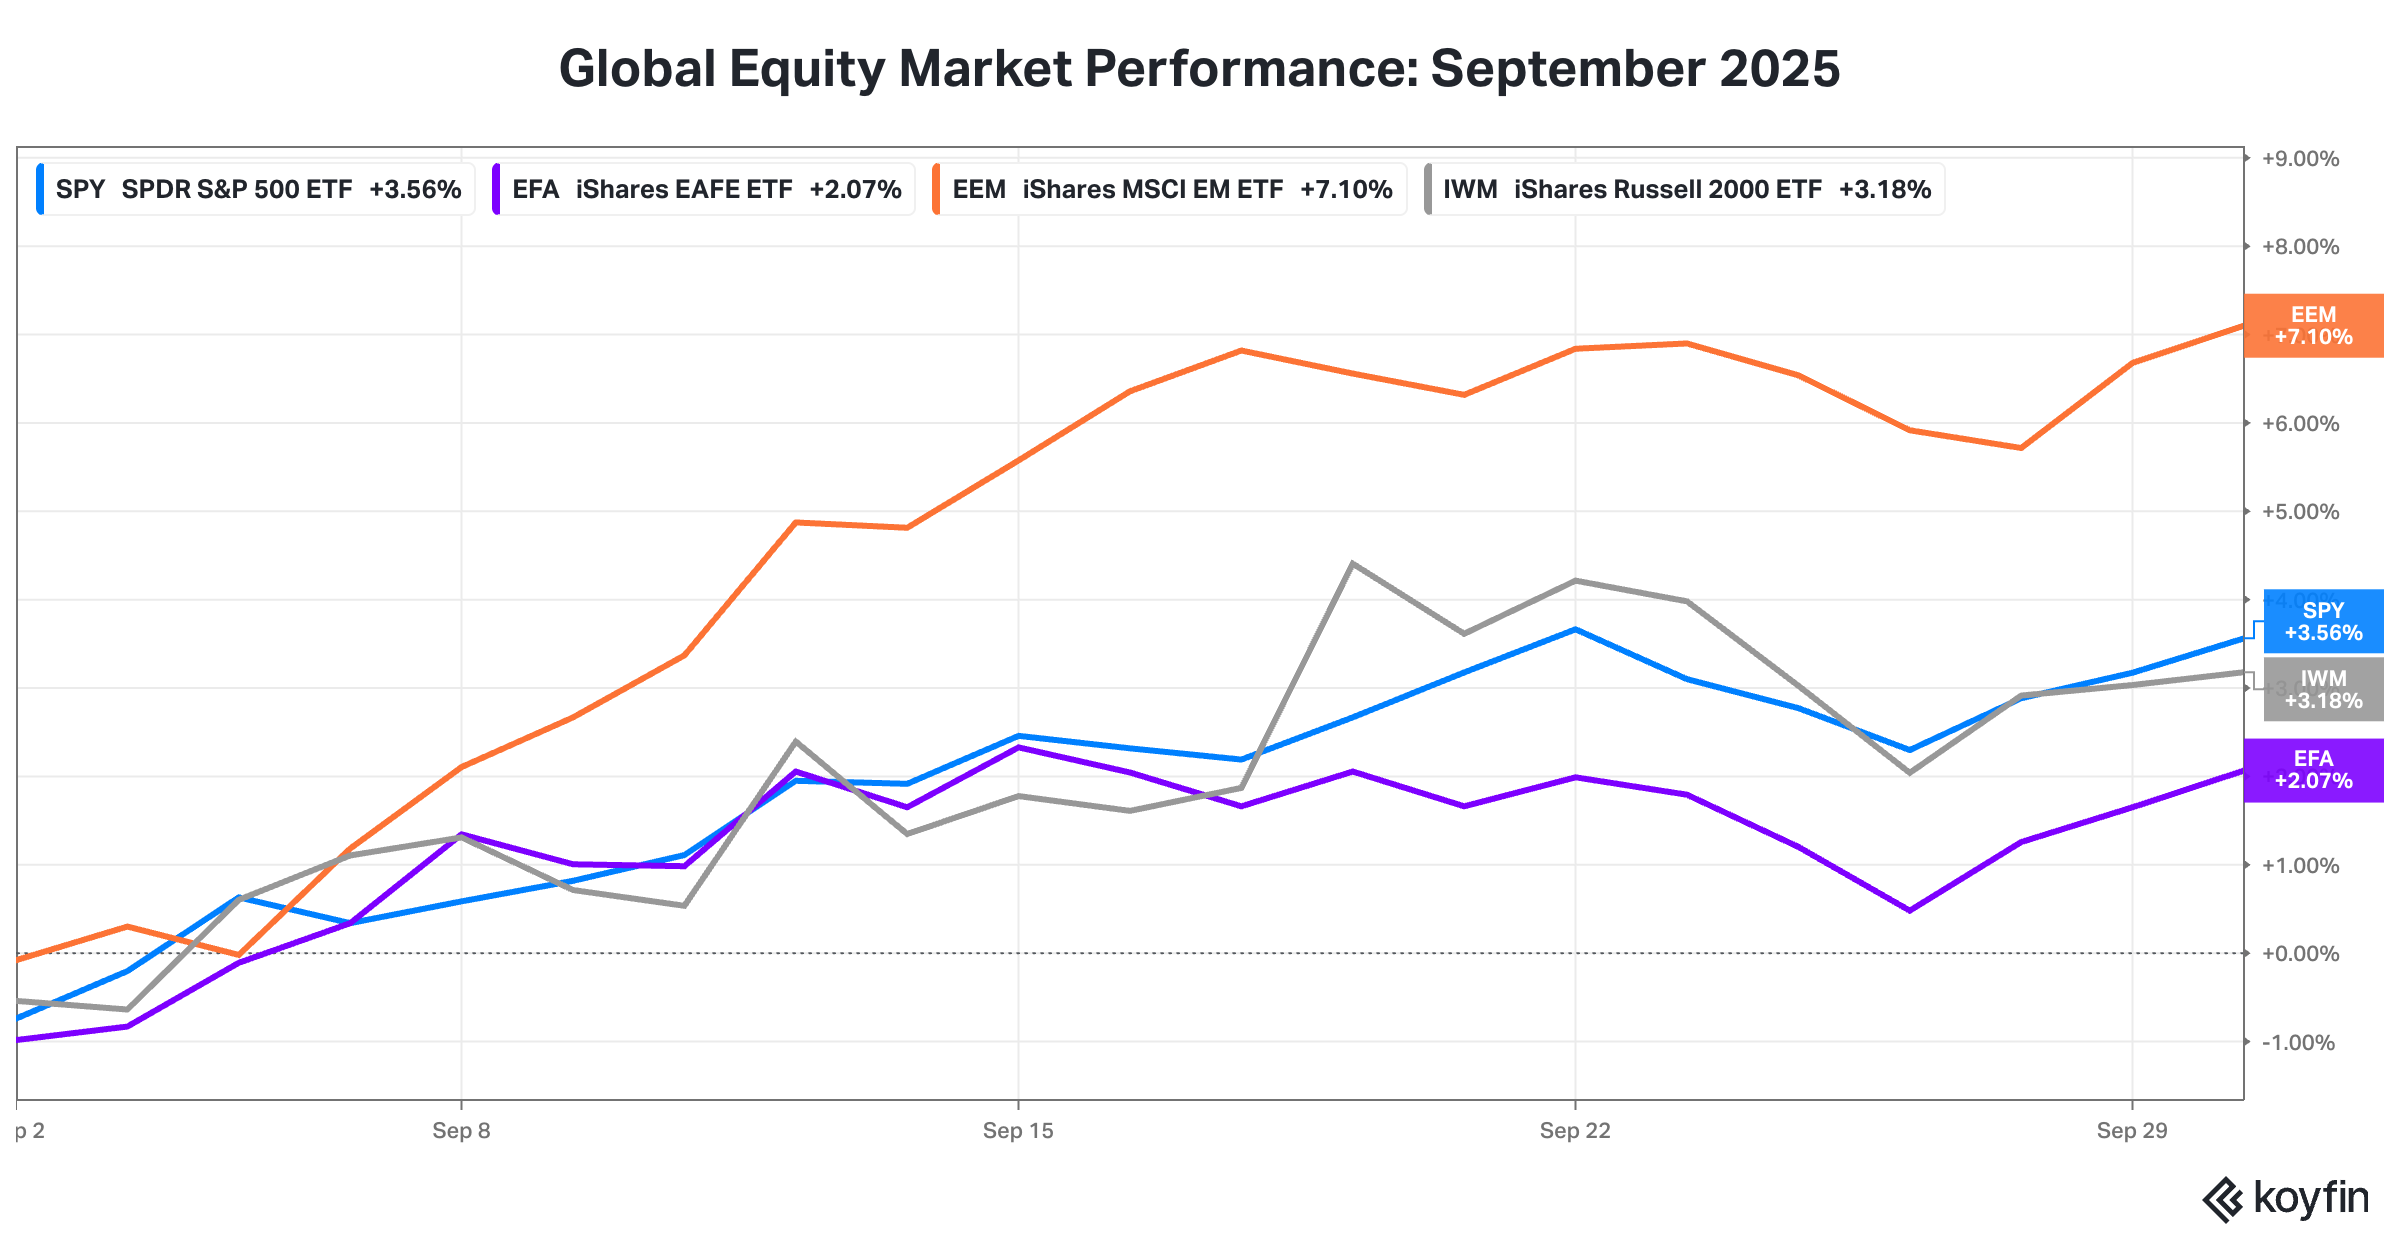
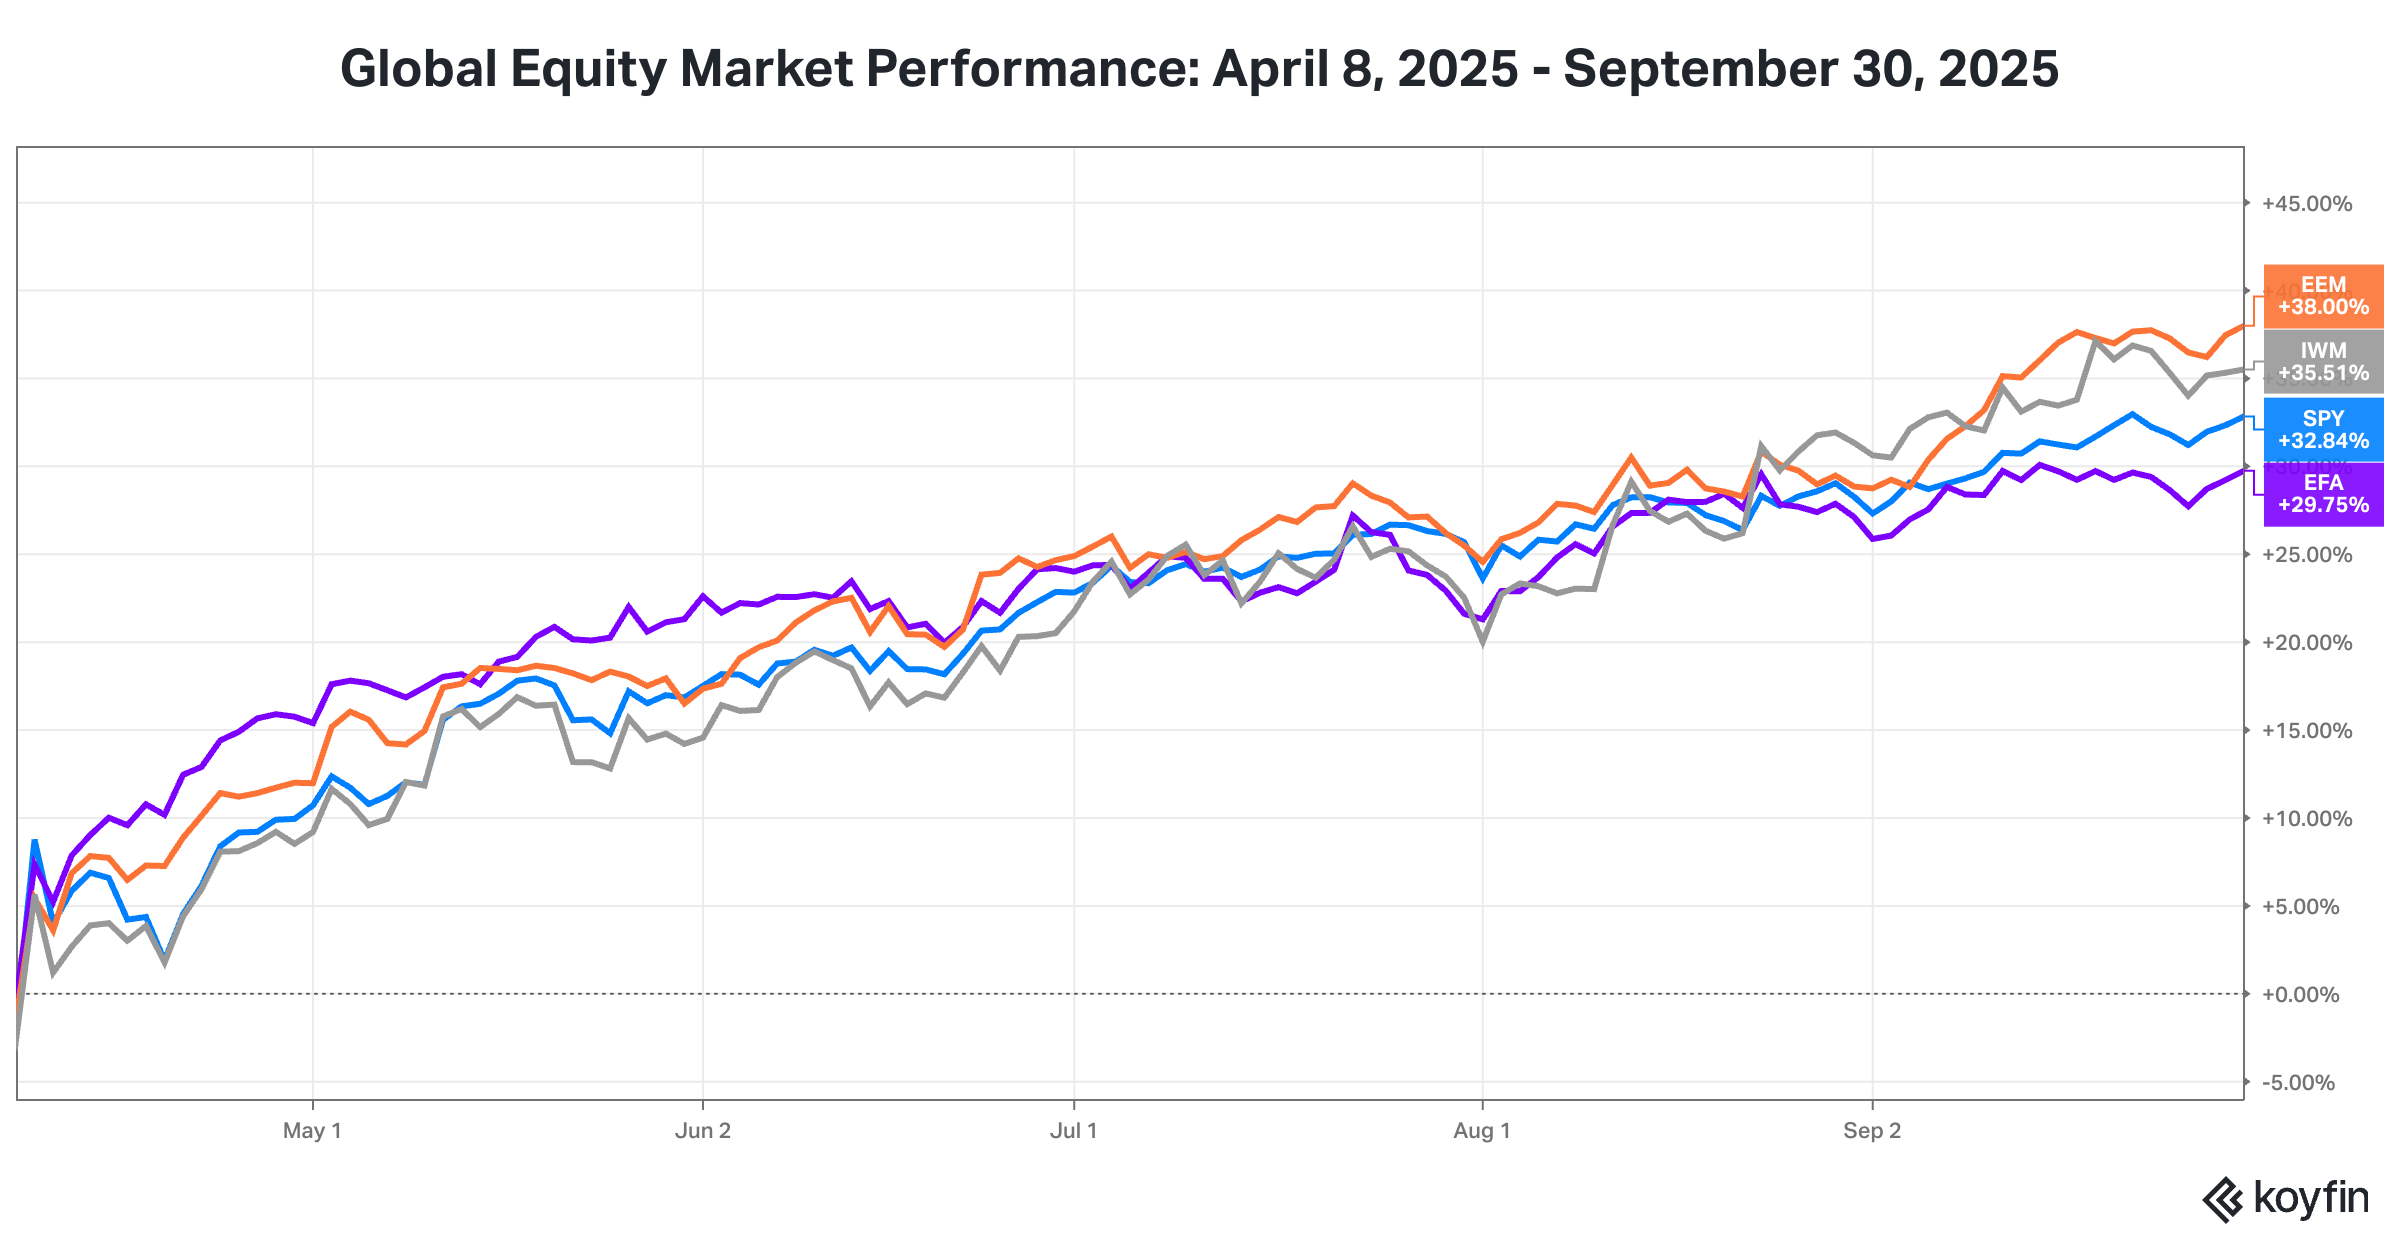
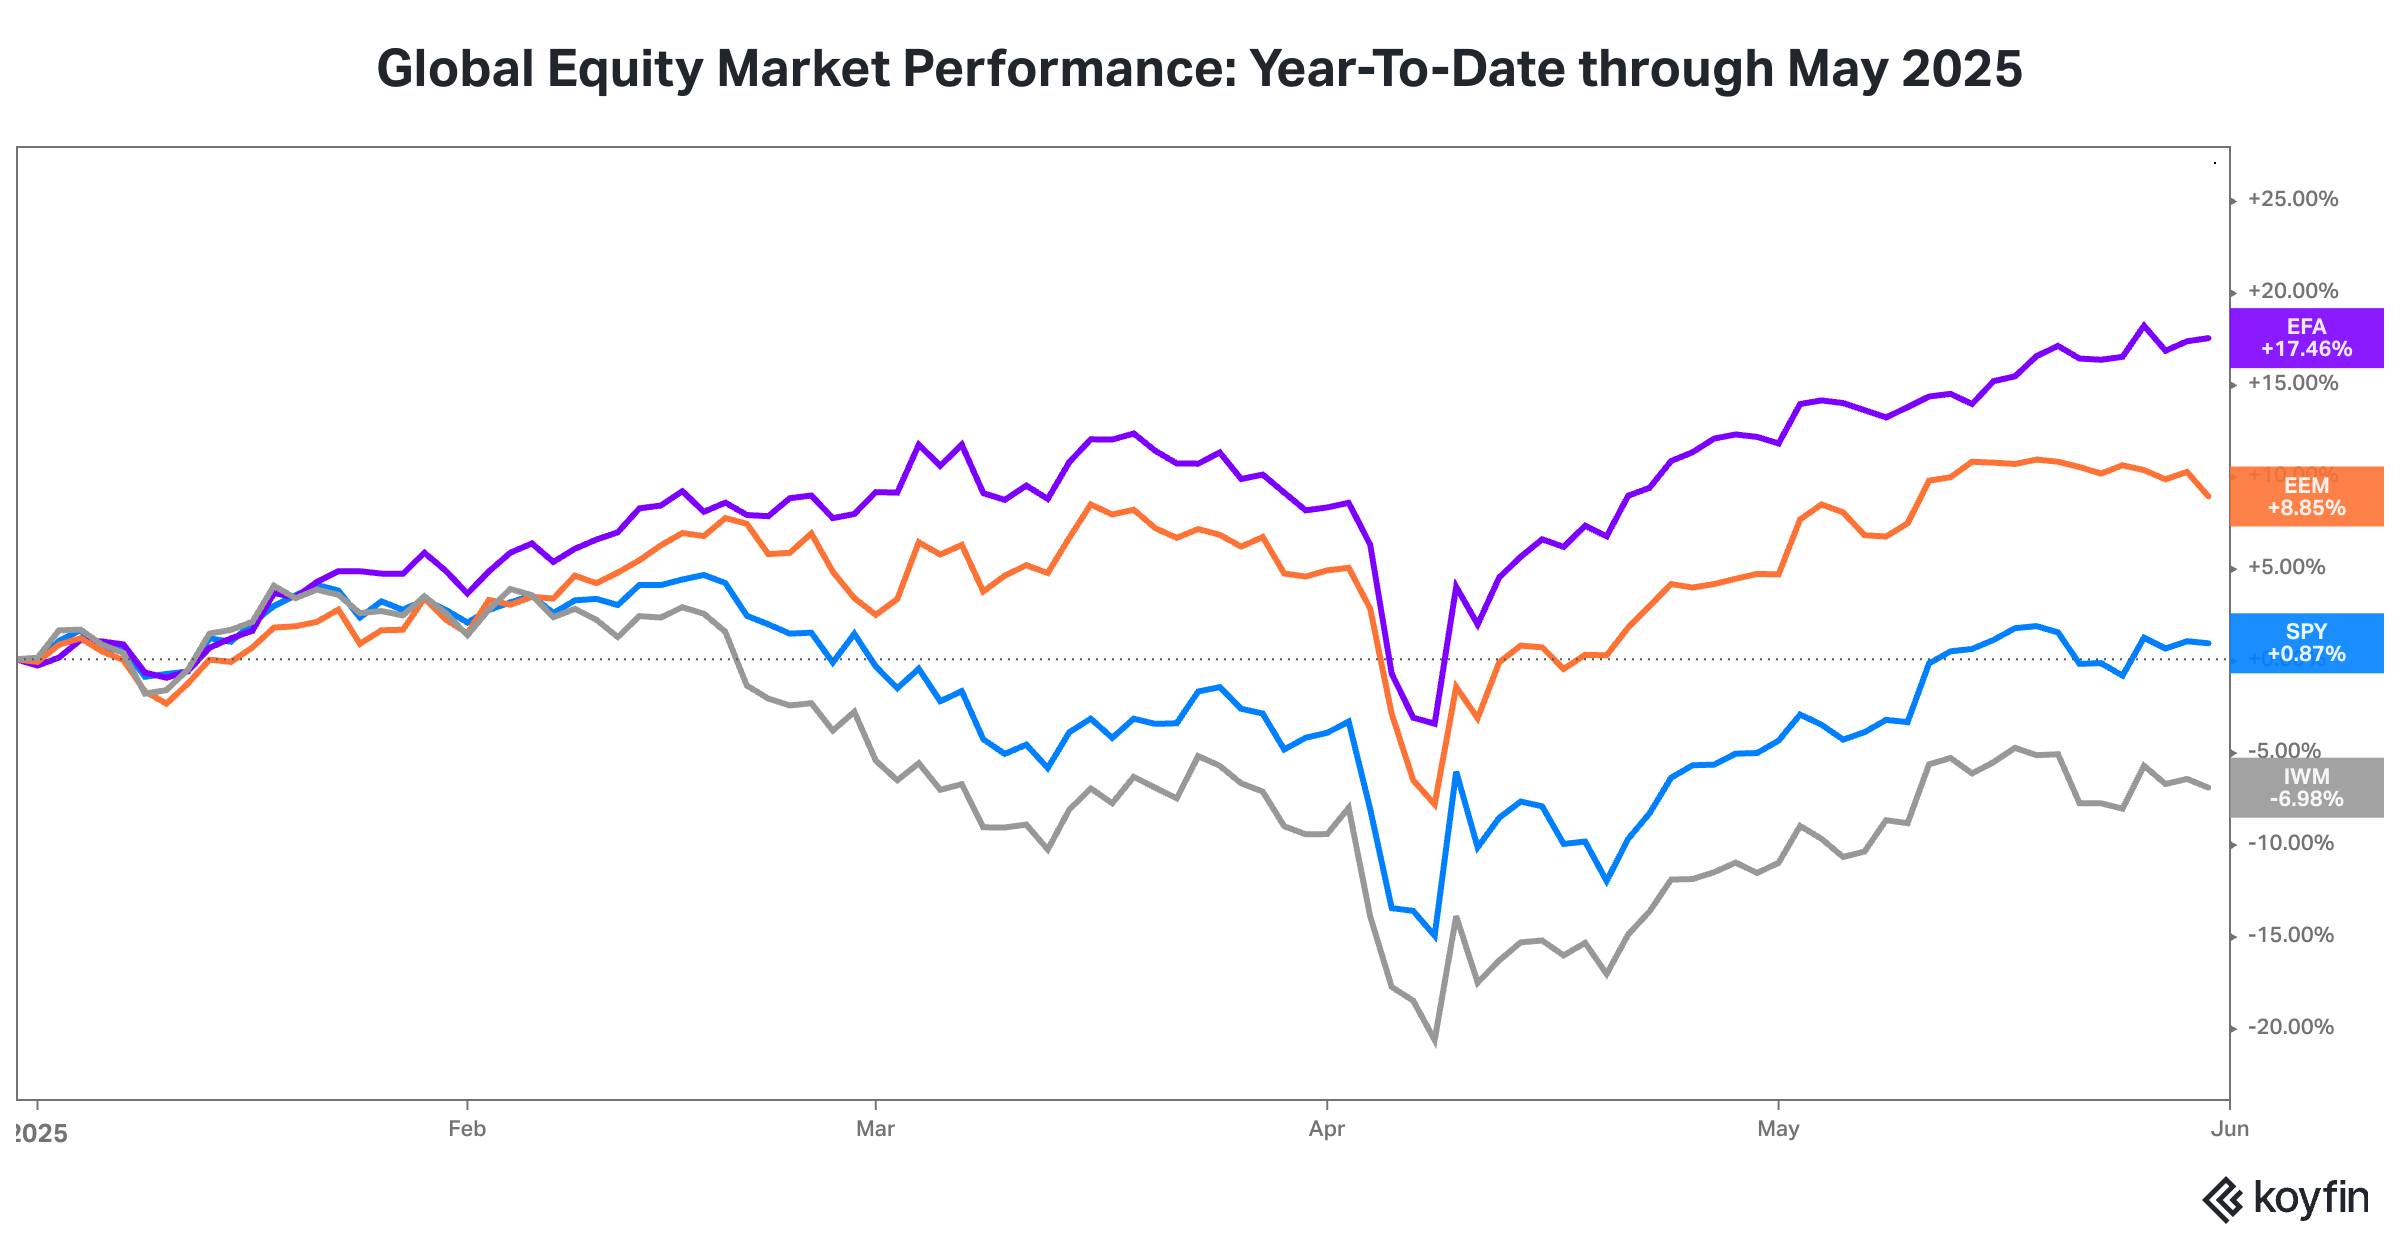
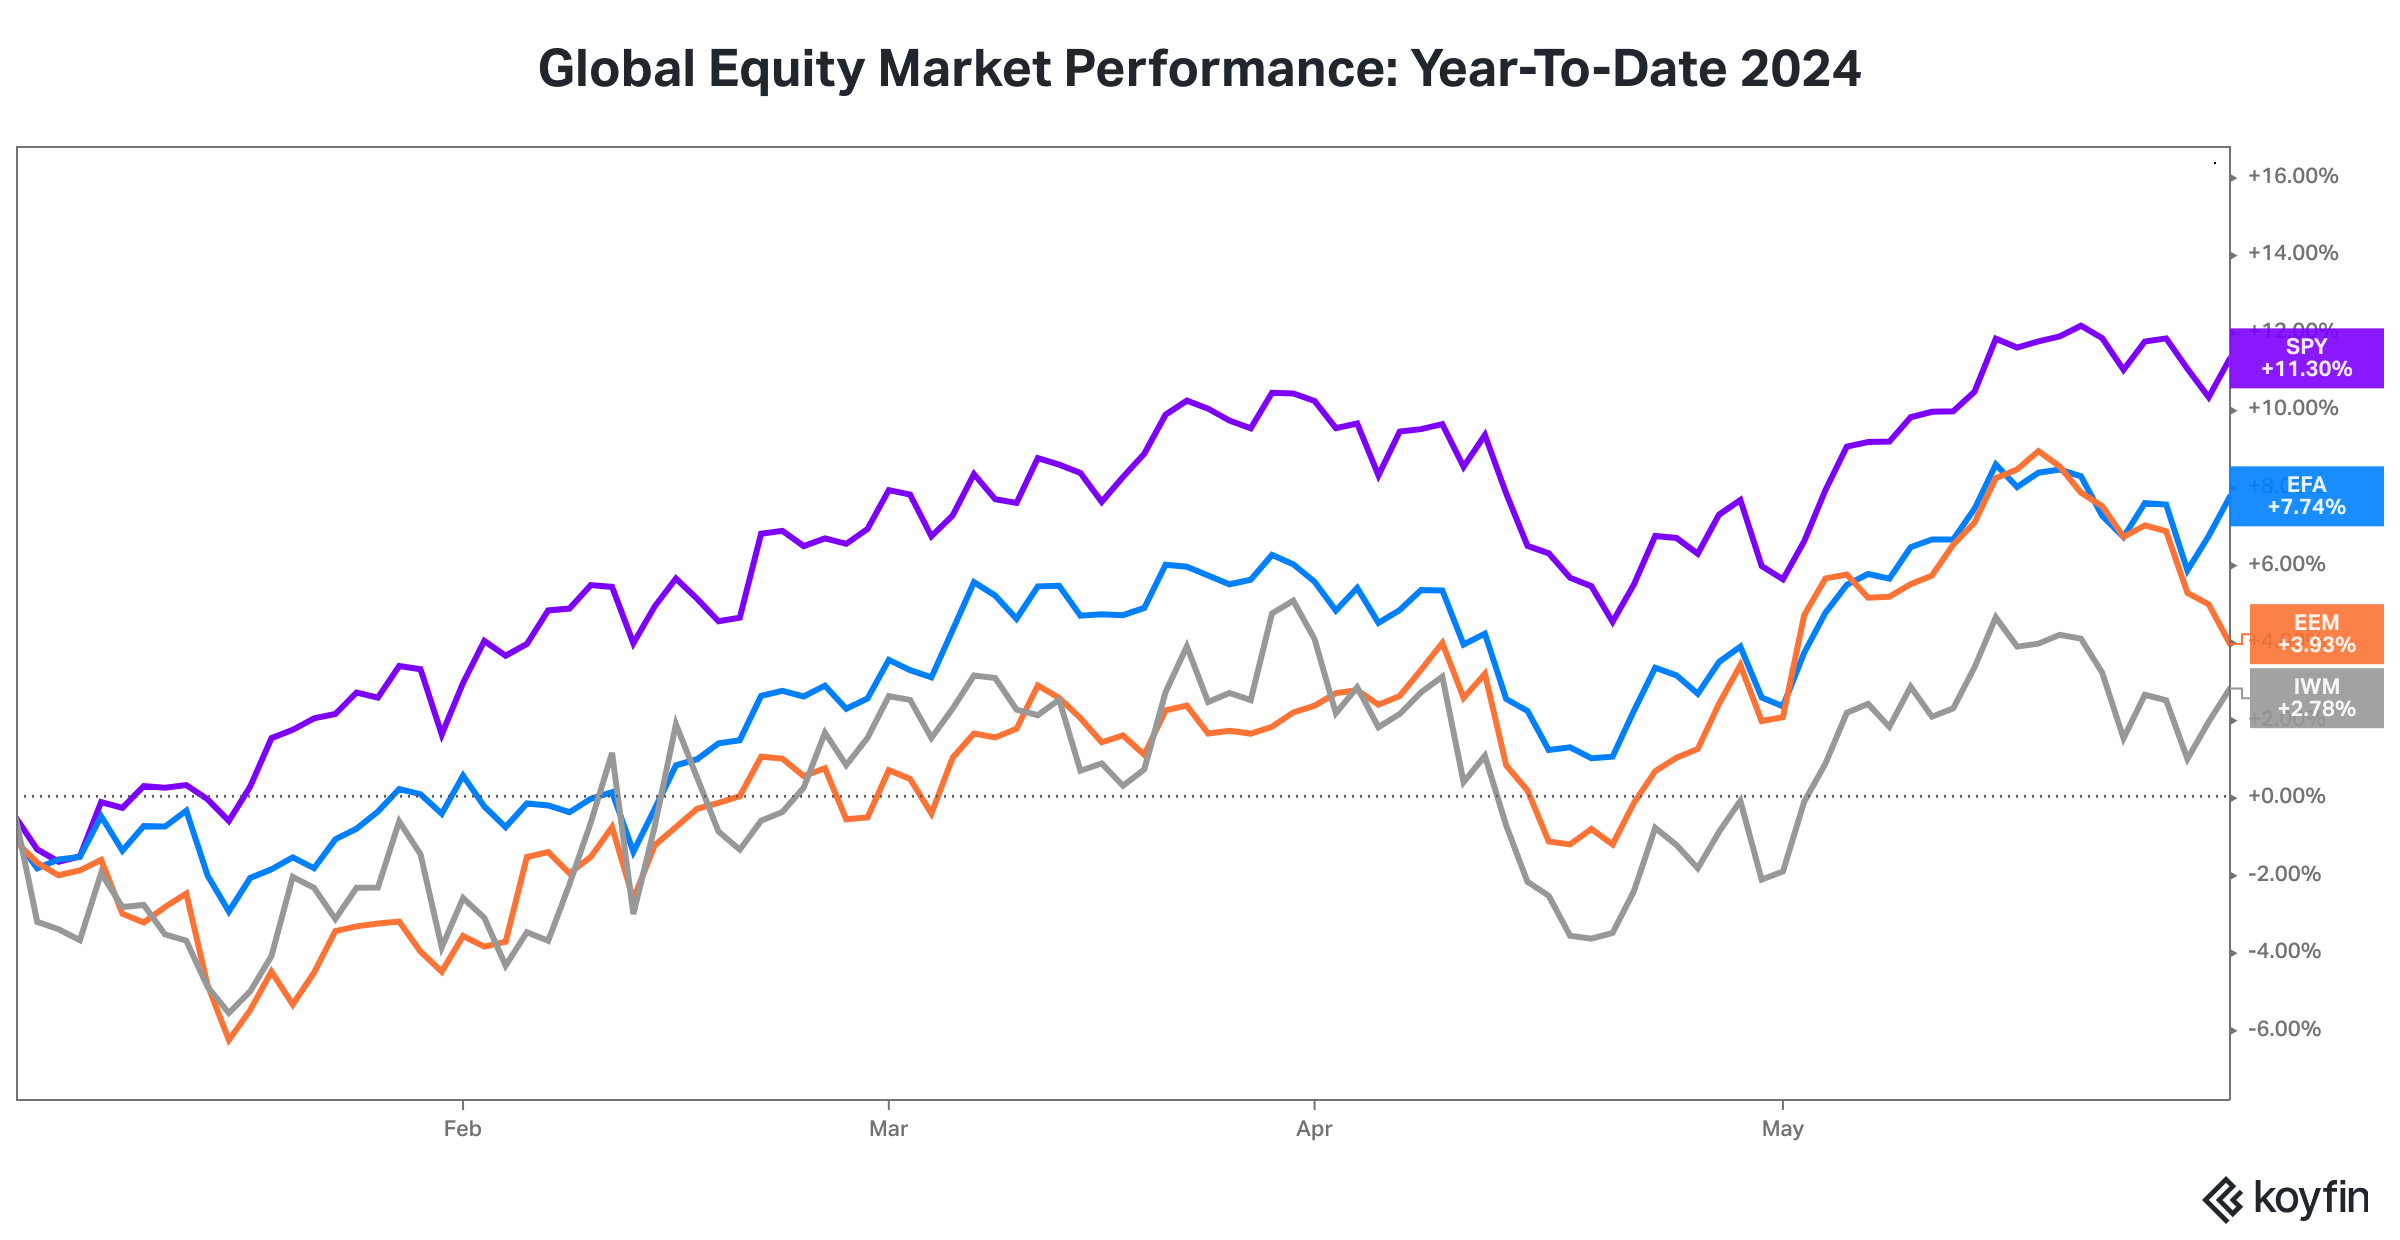
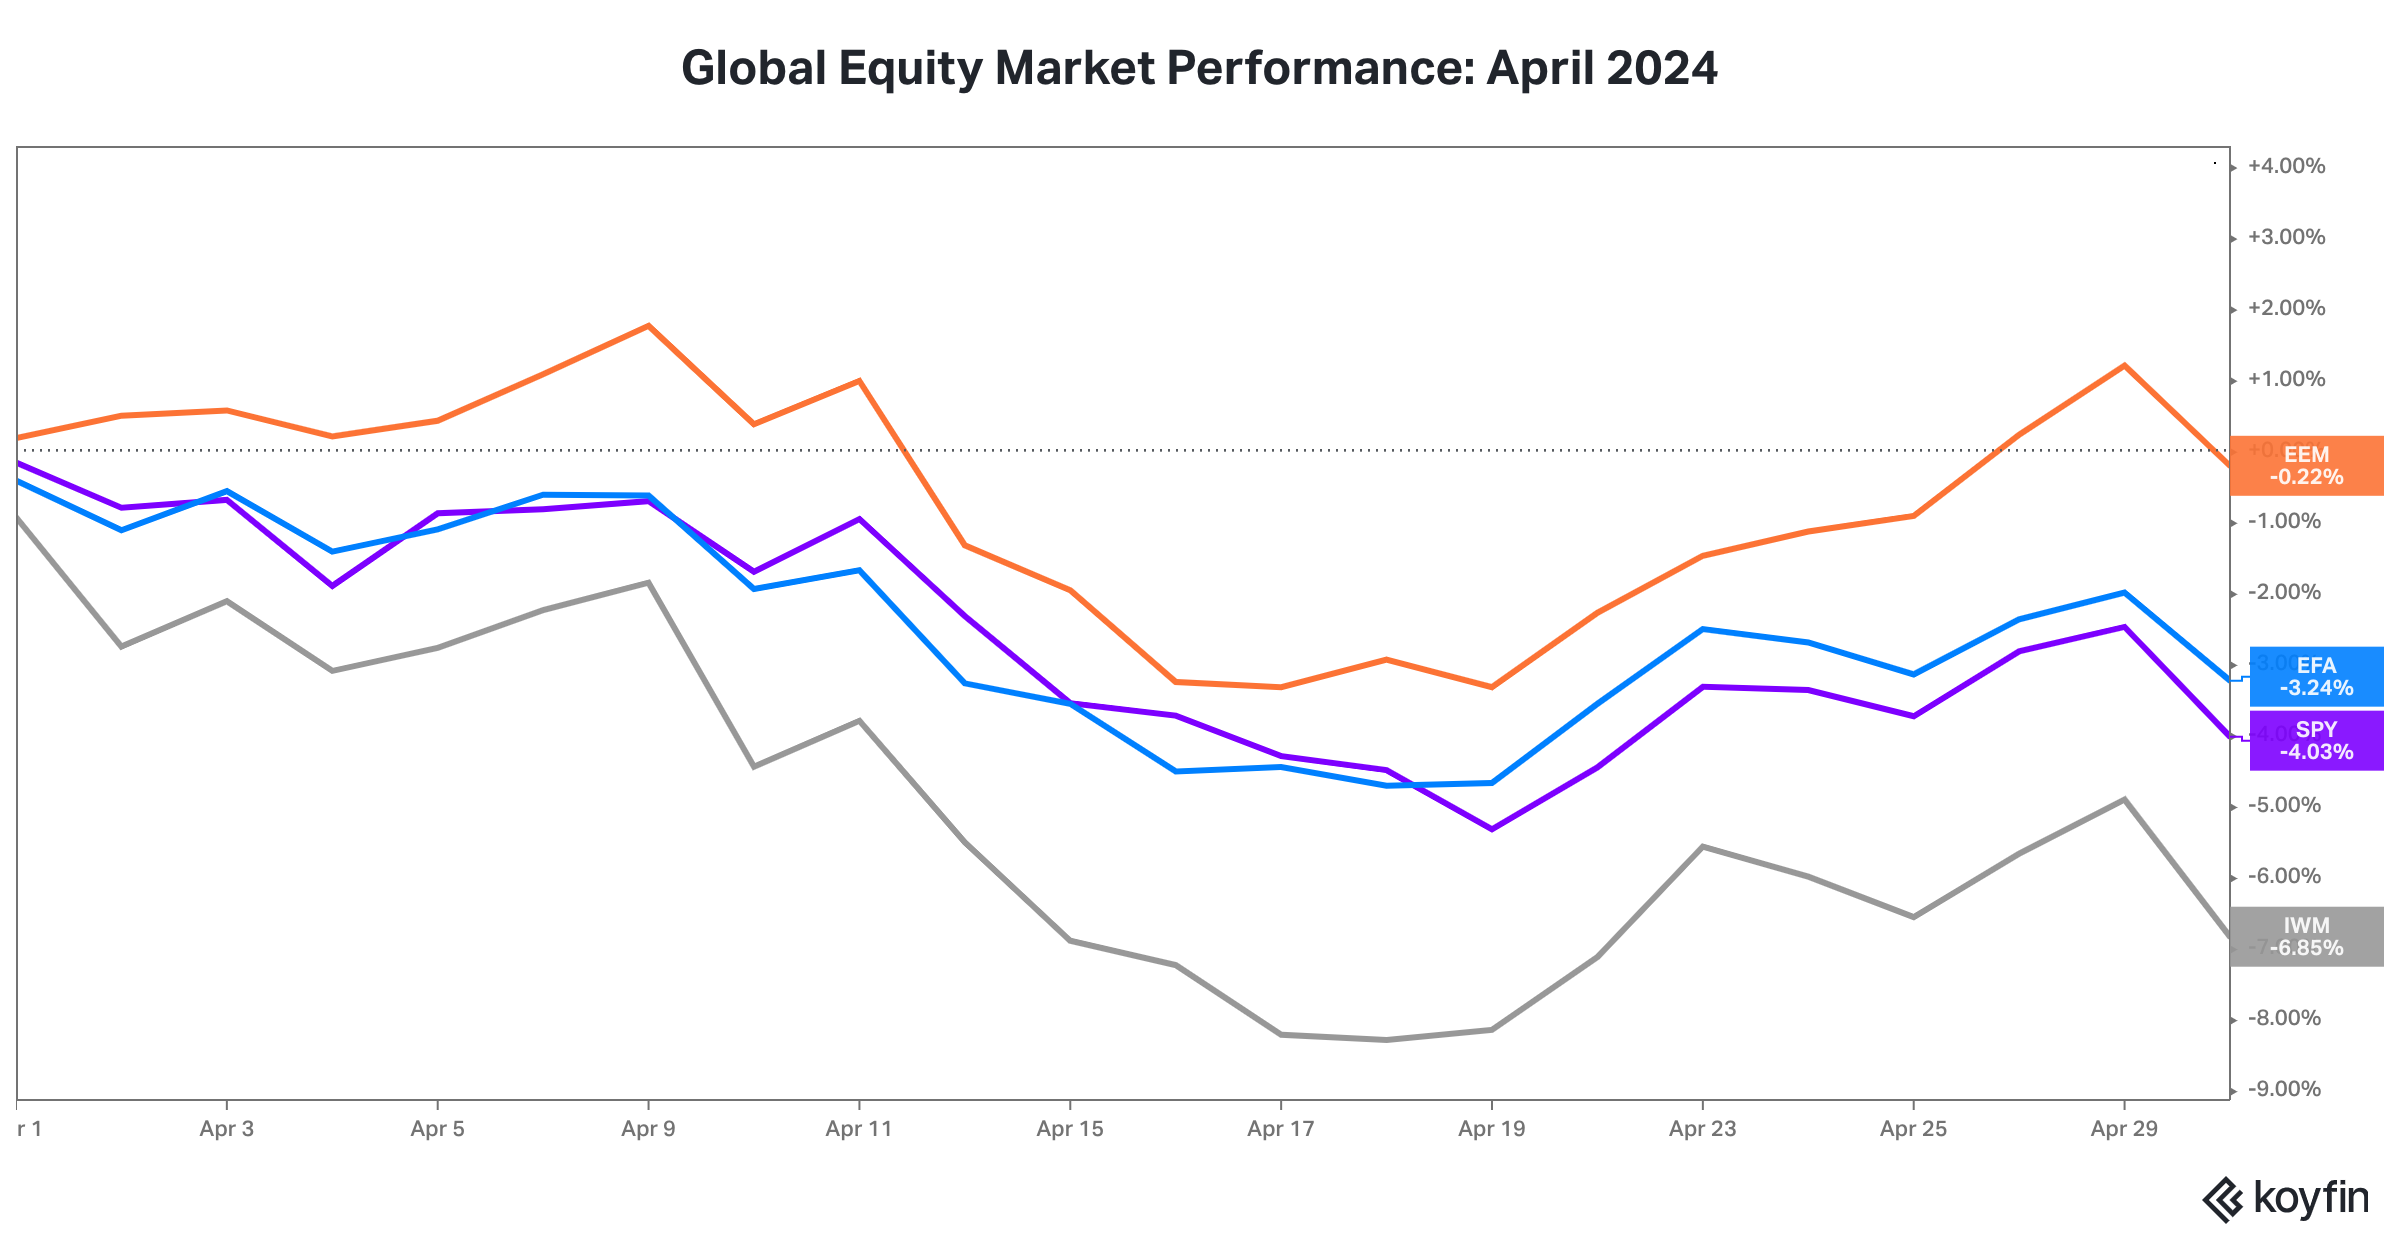
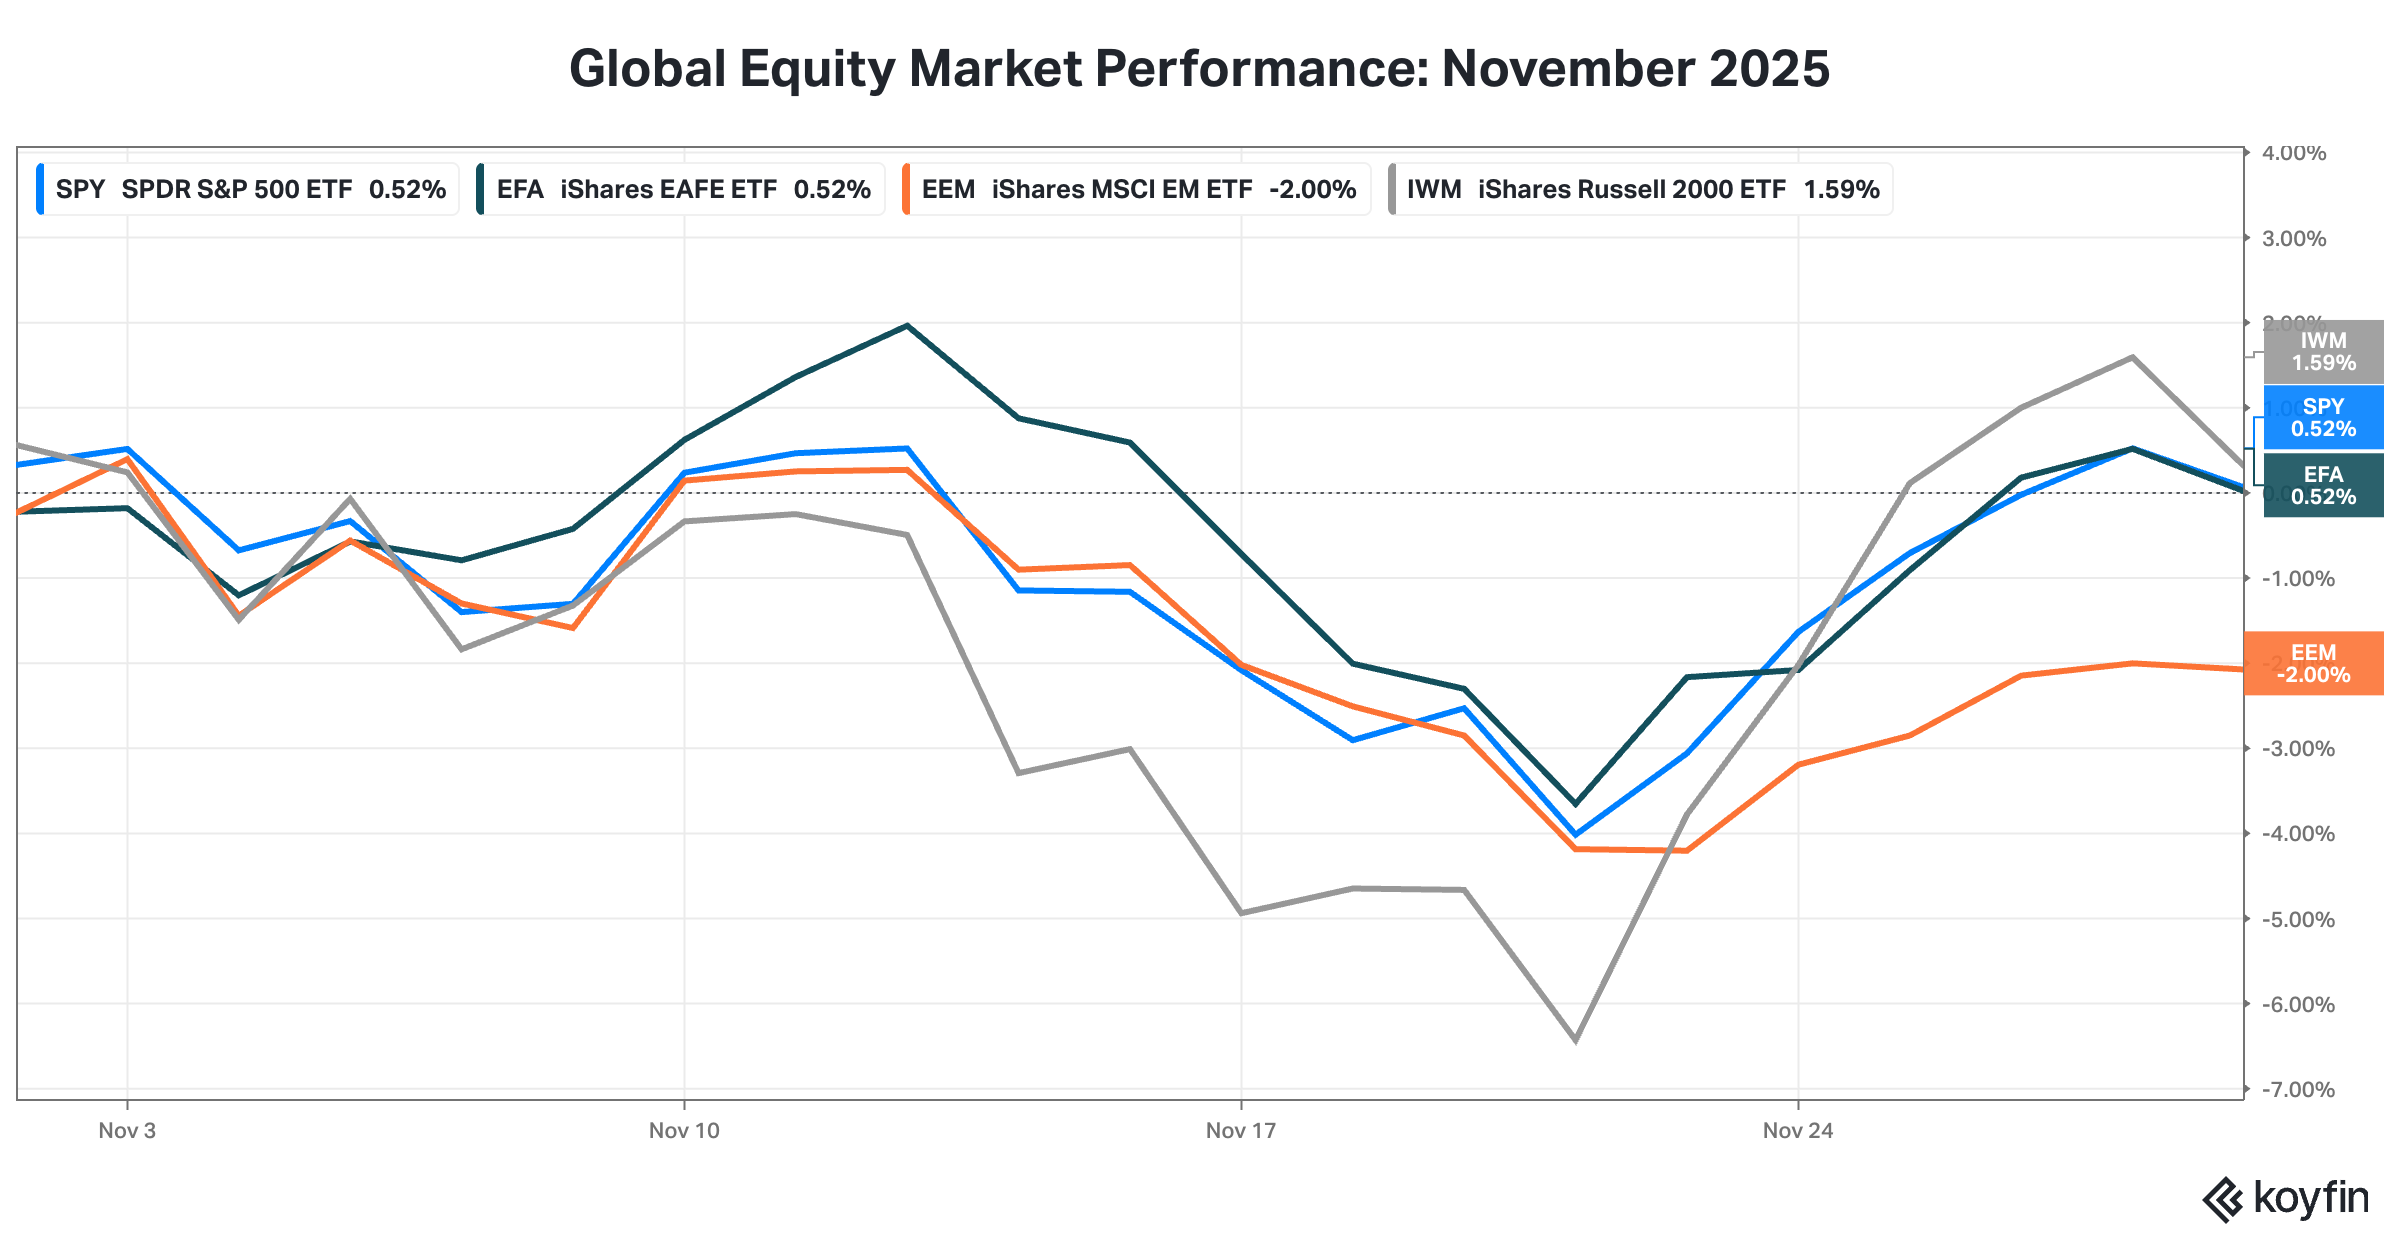
1. Global equity markets dipped mid-month but rebounded by month end.
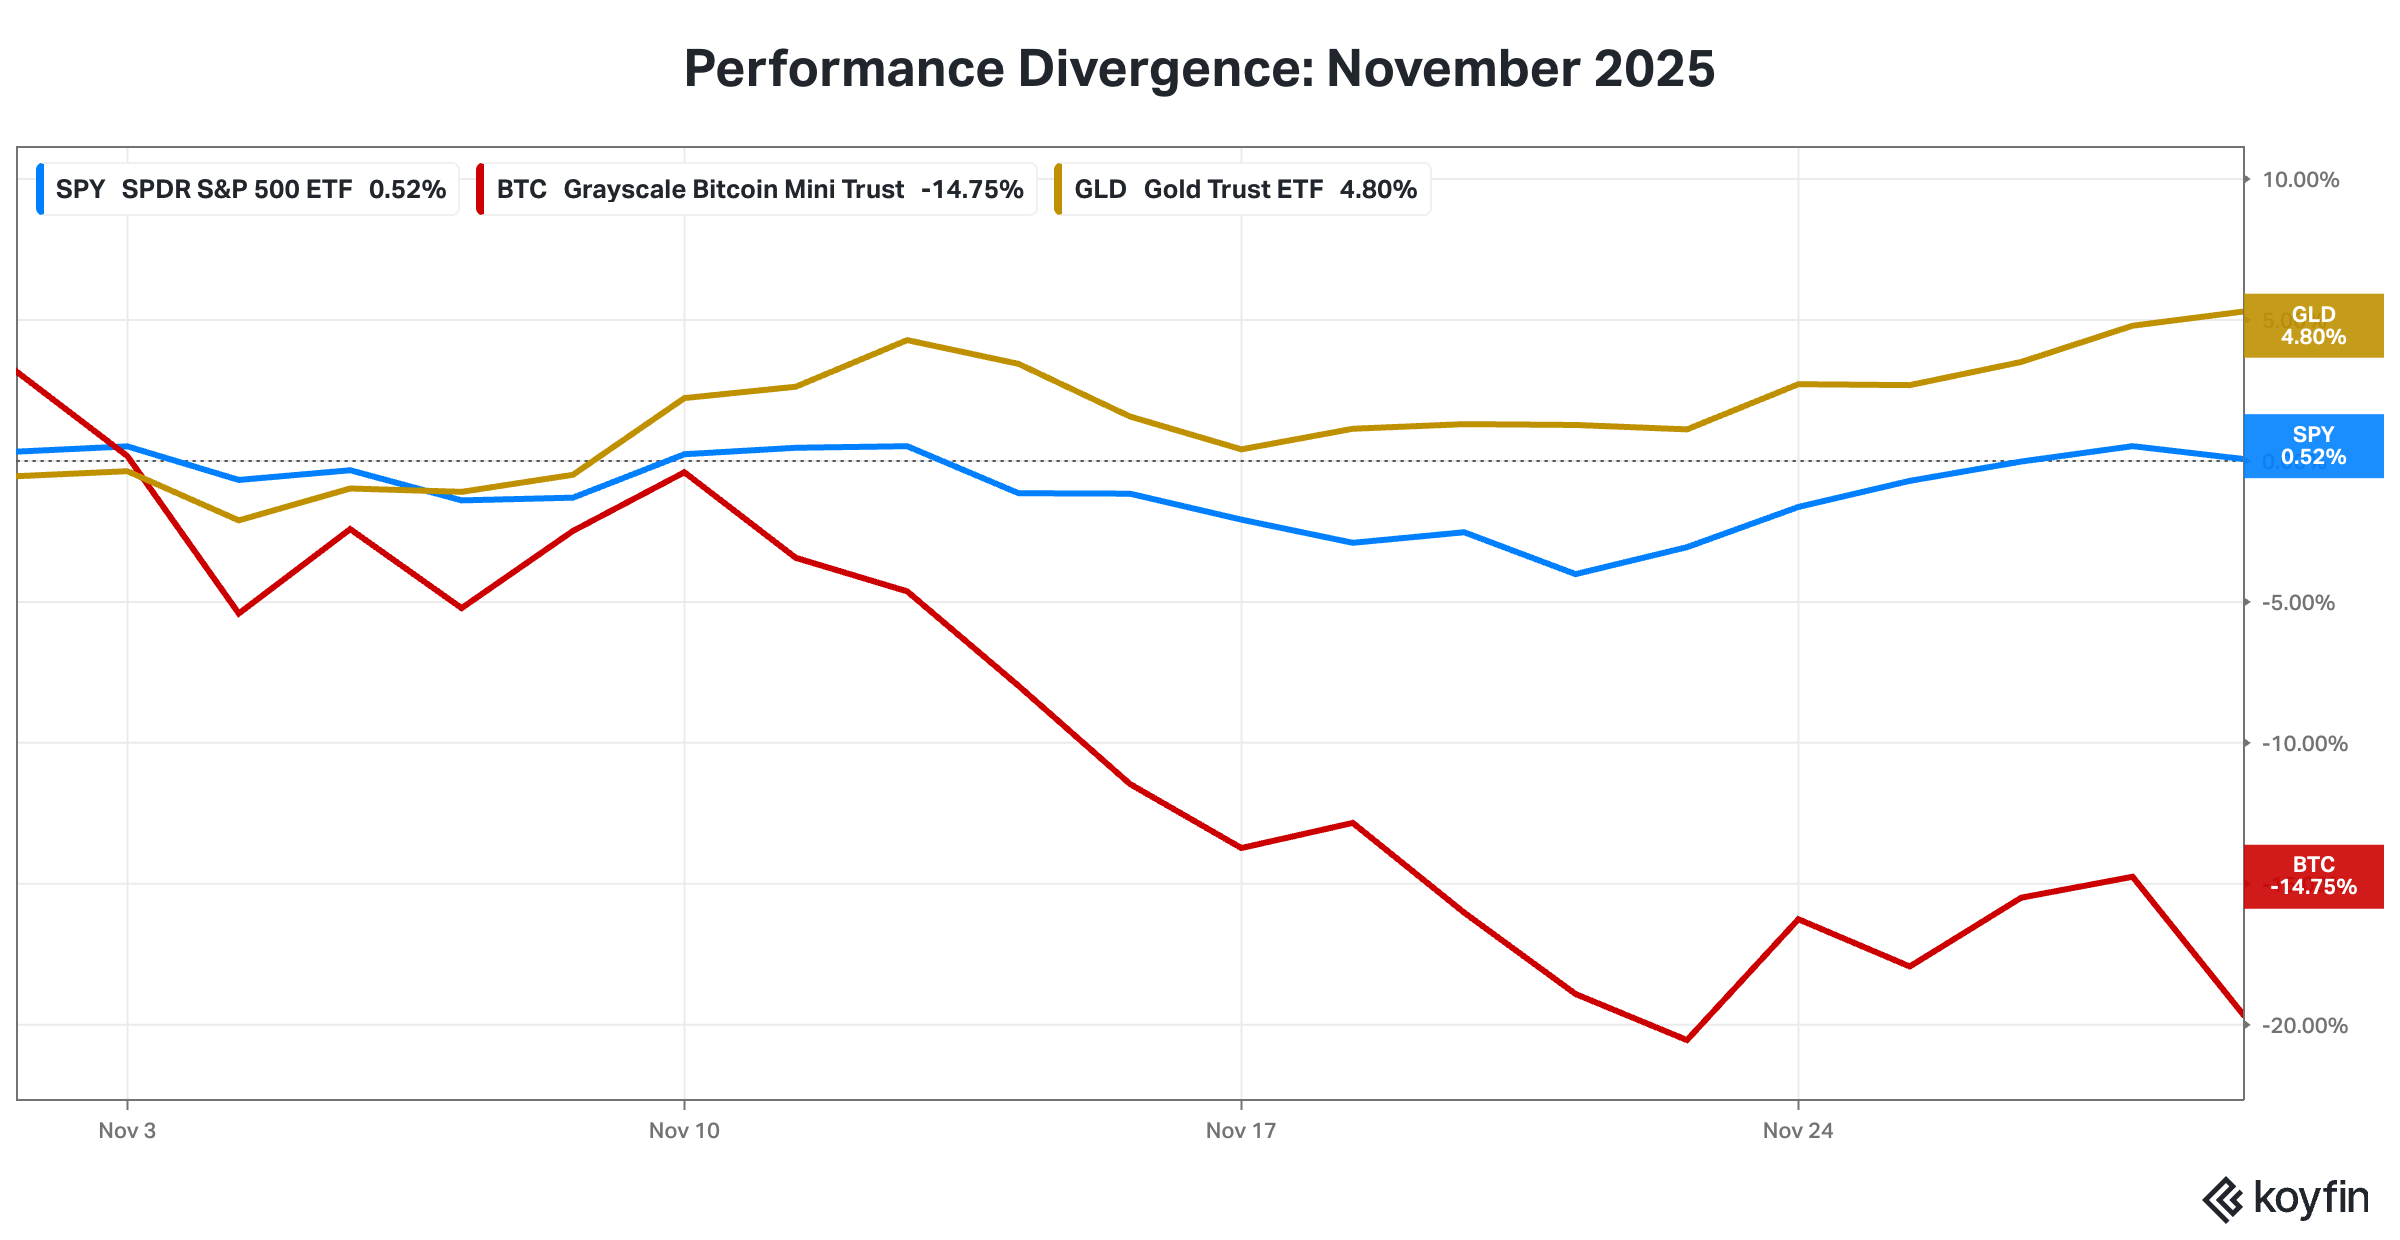
2. Bitcoin also dipped mid-month but did not rebound.
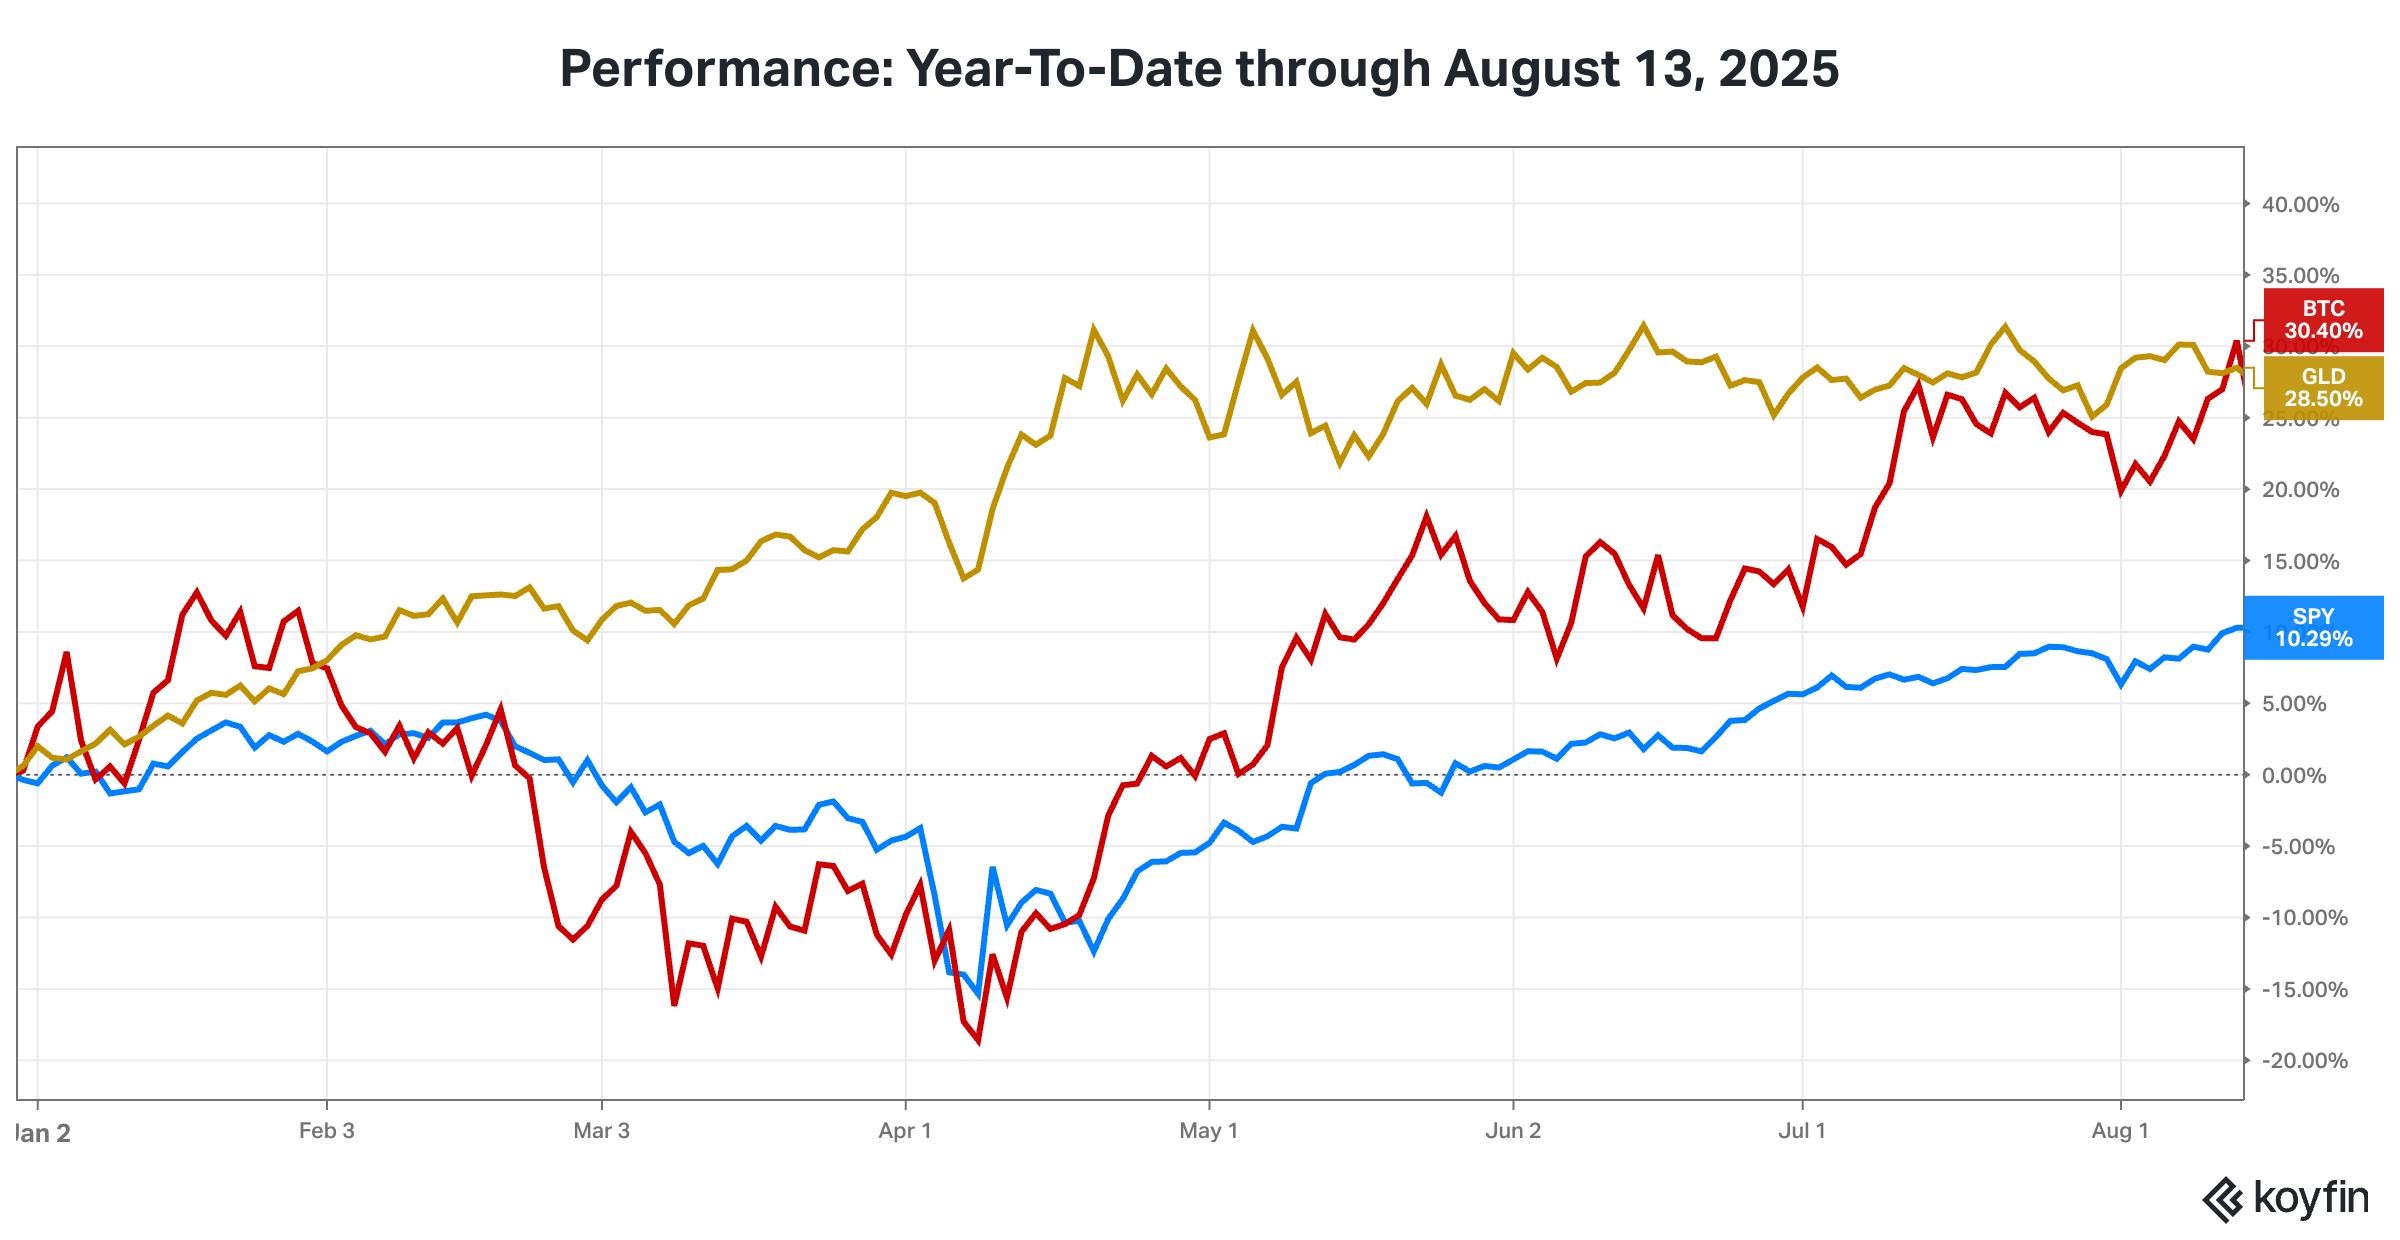
3. Through August 13, Bitcoin and Gold were neck and neck, both outperforming the S&P 500 Index for the year.
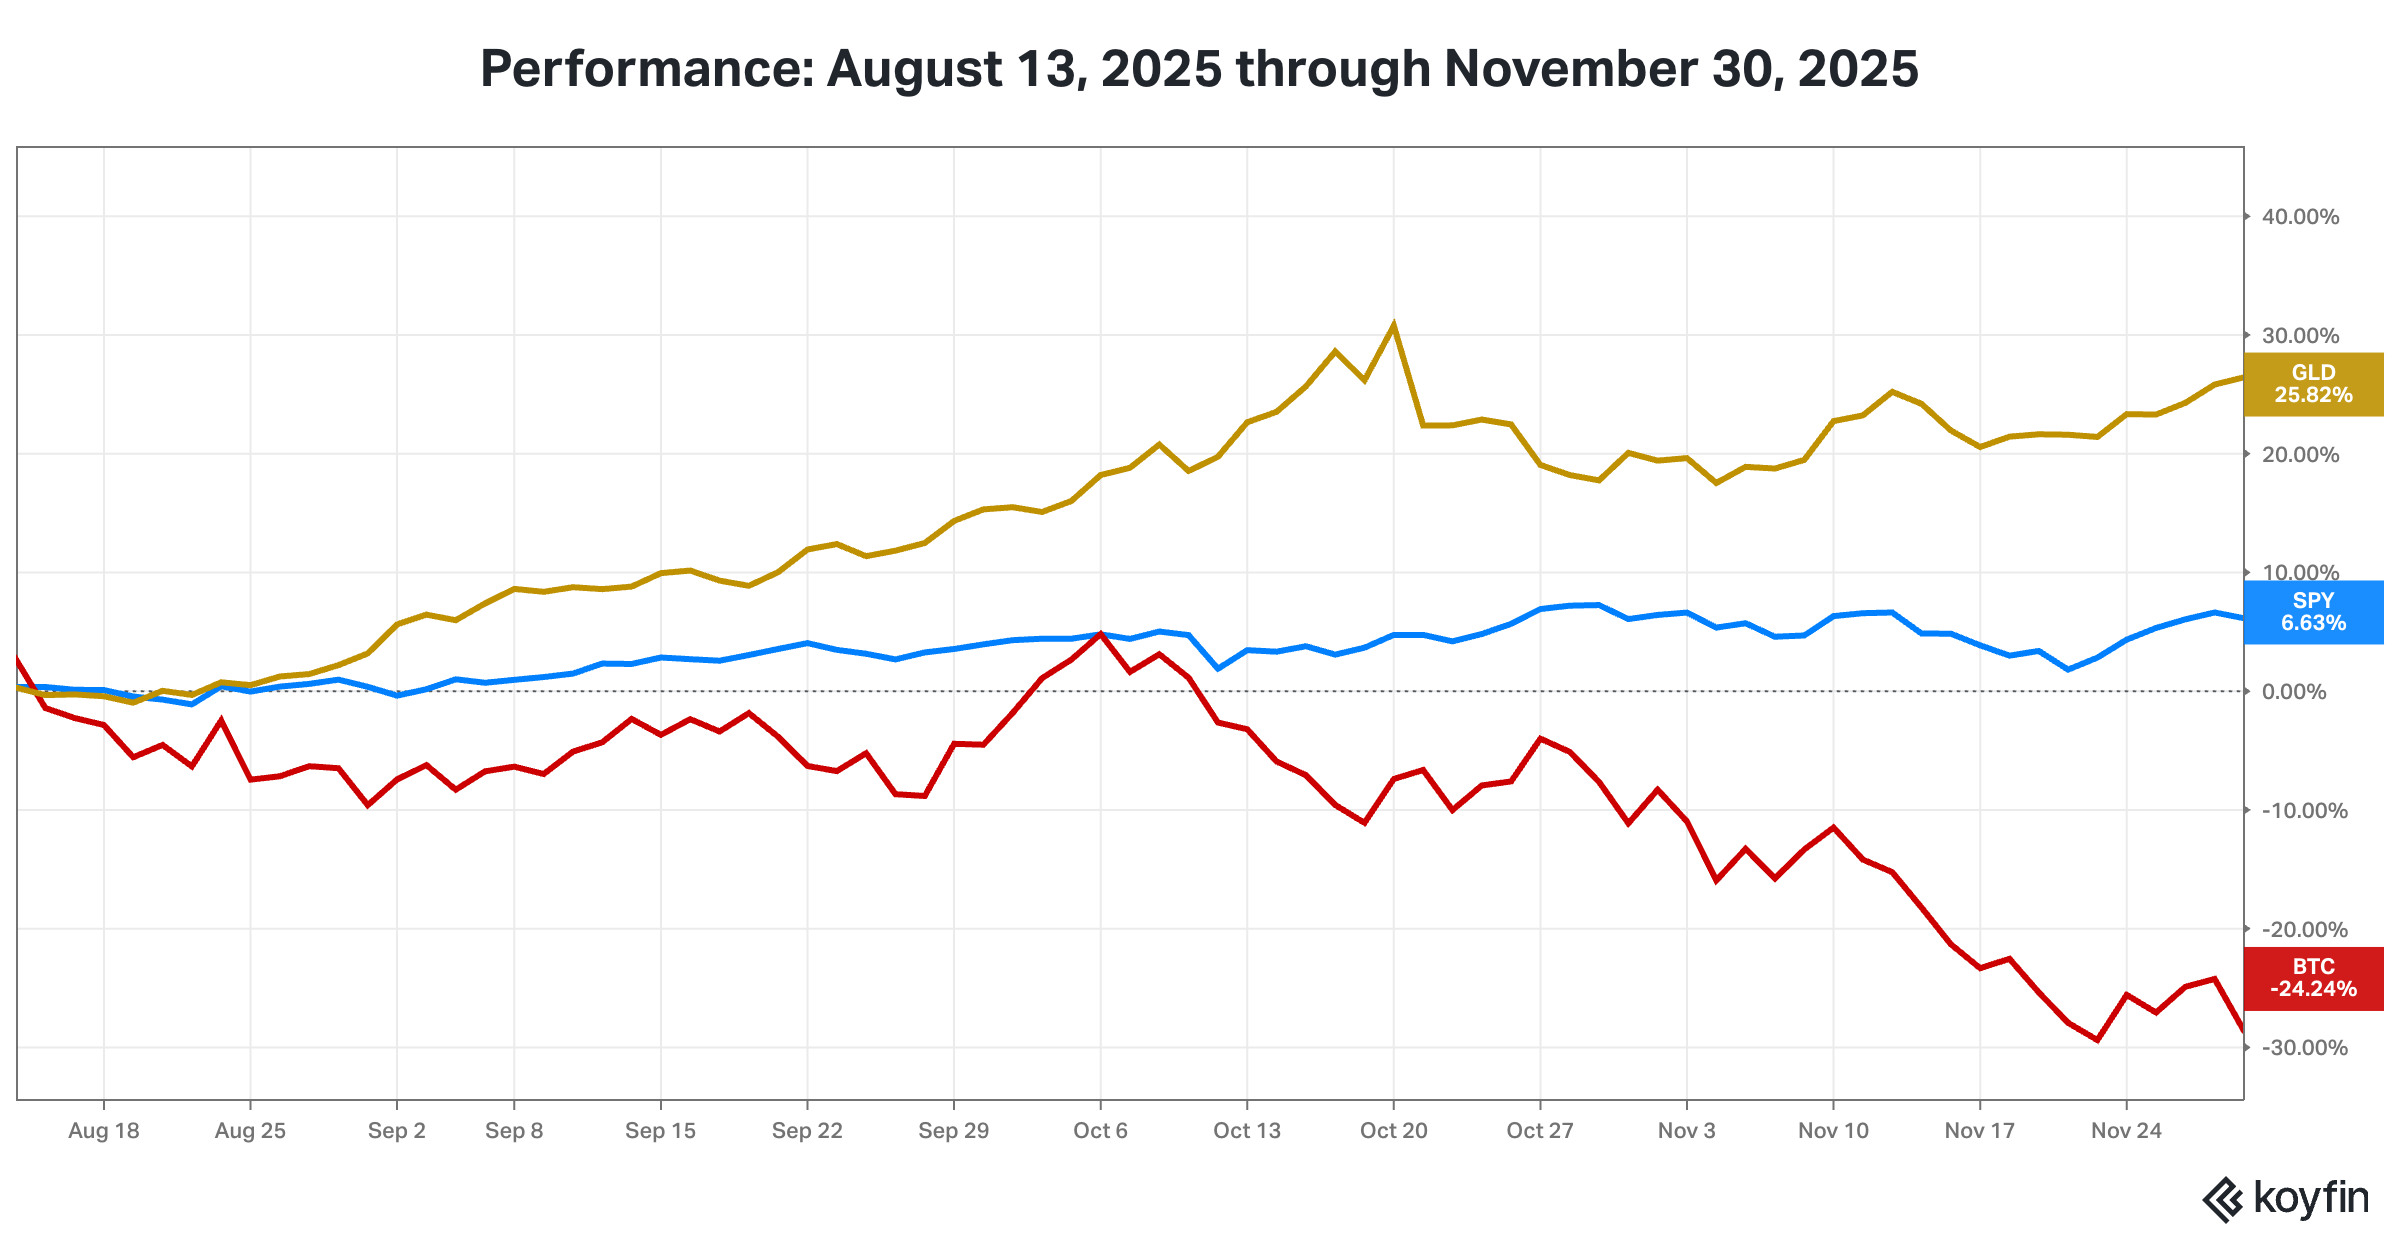
4. Post August 13, Gold continued to outperform. Bitcoin started lagging and its performance fell off a cliff in early October.
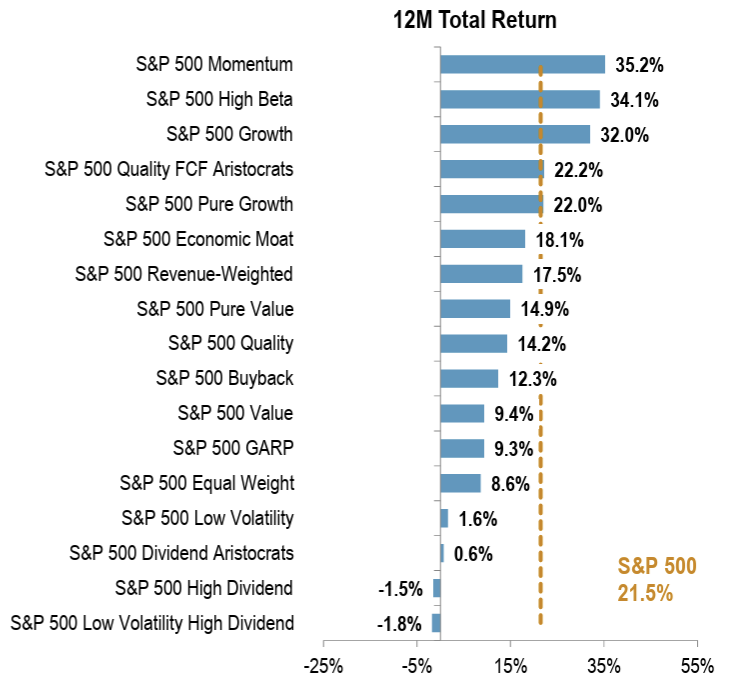
5. Over the last year, and especially over the seven months from April through October, high beta stocks, stocks with strong one-year price momentum, and growth stocks have been big outperformers in the U.S. equity market. Dividend payers, value stocks, and low volatility stocks have been big laggards.
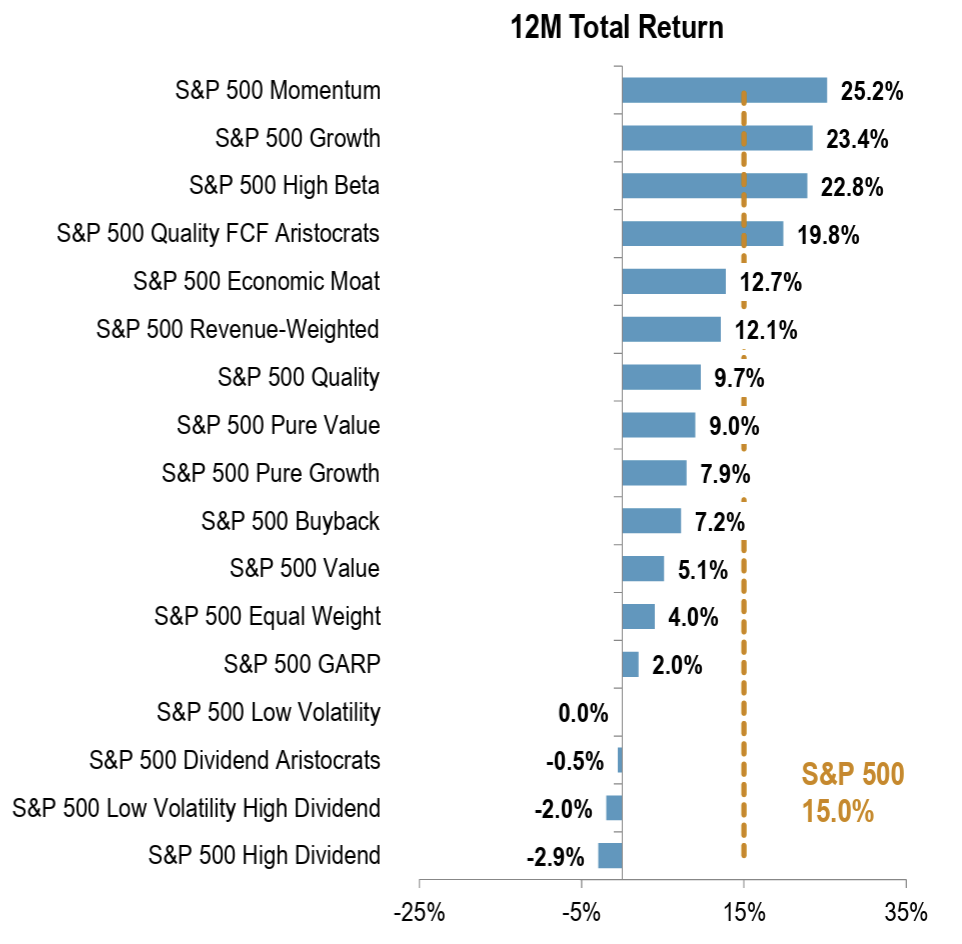
Source: S&P Dow Jones Indices
6. In November, factor performance was flipped on its head. High beta, price momentum, and growth were the laggards and dividend payers, value, and low volatility were the leaders.
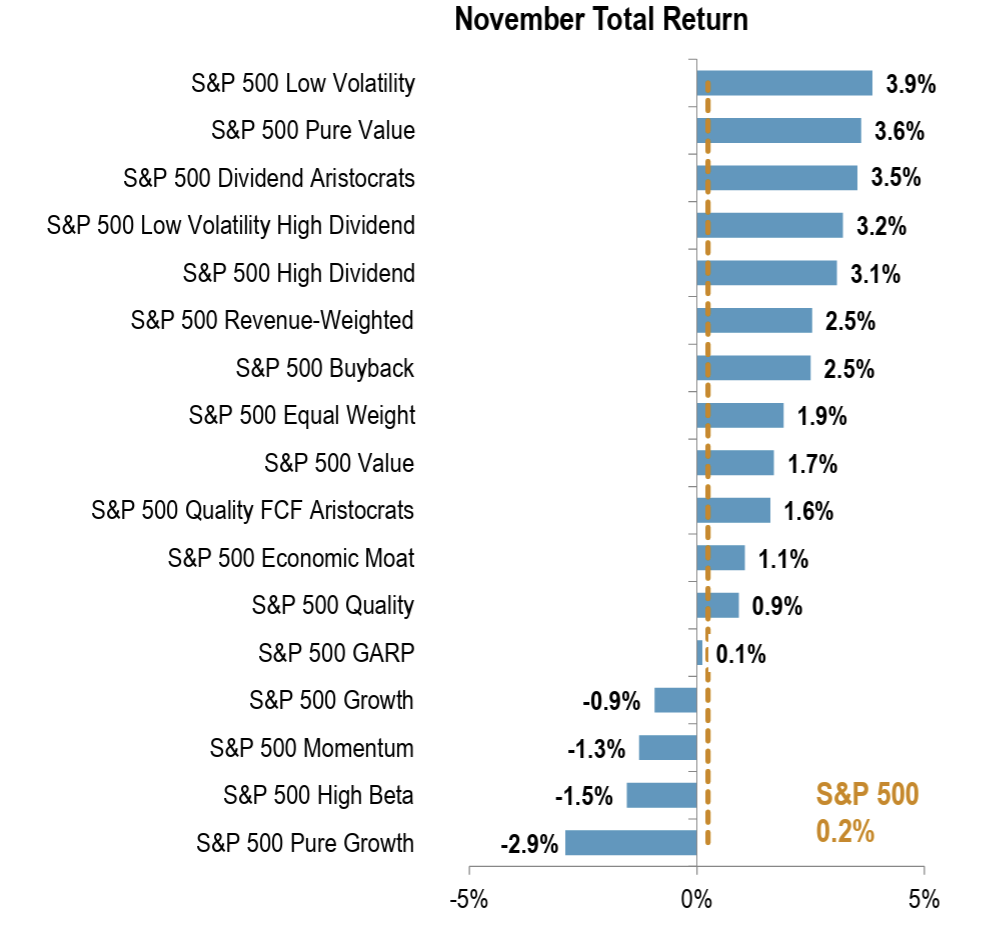
Source: S&P Dow Jones Indices
Disclosure
"Two Centuries Investments is a registered investment advisor. That material is for general information and reference purposes only and does not constitute tax, legal, or investment advice and is not intended as an offer to sell, or a solicitation to buy securities, services or investment products. All information has been obtained from sources believed to be reliable, but accuracy is not guaranteed, and reliance should not be placed on the information presented. This material may not be reproduced, copied, or transmitted, or any of the content disclosed to third parties, without the permission of Two Centuries Investments. Past performance is not a guarantee of future results."