
Here are the top market developments from August. Along with a few questions.
1. US equities rose for the 7th month in a row. Is the price right?
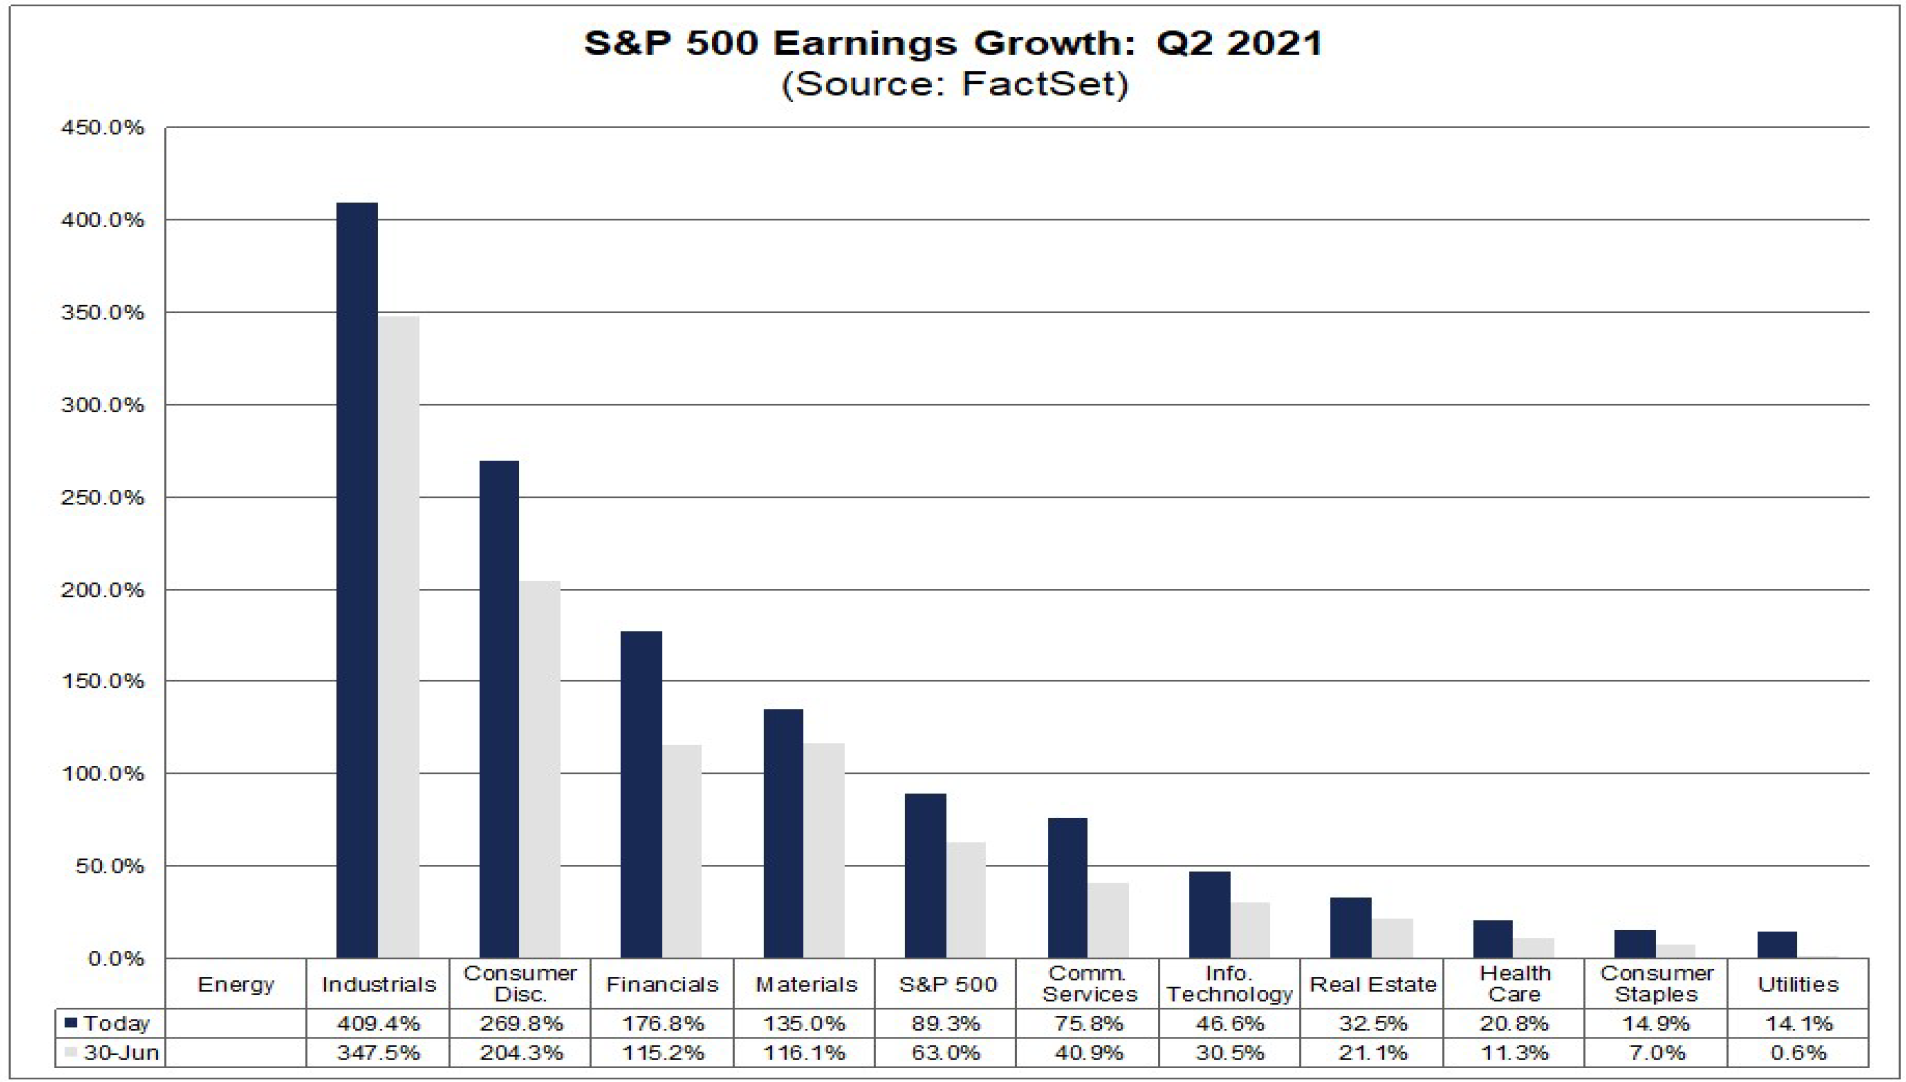
Lucky Seven is a game on the well-known show “The Price is Right”. More than luck was in play as the S&P 500 Index rose for a seventh straight month in August. Strong corporate earnings, accompanied by a favorable backdrop of accommodative monetary policy and a massive increase in fiscal expenditures, have driven a 20.4% rise in the index year-to-date. According to FactSet, S&P 500 earnings were up 89% year-over-year in the second quarter of 2021 (with 91% of companies having reported).
The US equity market is now up over 100% since the March 23, 2020 low. Some investors are starting to wonder whether the price is right, or too high, for US equities.
2. Earnings growth is through the roof in Europe. Is the price better?
Second quarter earnings growth was even stronger in Europe than in the US. According to FactSet, with more than 85% of companies in the STOXX Europe 600 Index having reported, earnings are up 248% year-over-year.

Admittedly, Europe benefited more from operating leverage as the revenue differential (30% growth in Europe vs. 25% growth in the US) was much smaller than the earnings differential (248% growth in Europe vs. 89% growth in the US).
We have been warming up to non-US equities. The pricing appears to be better than US equities. For instance, while European equities usually trade a lower P/E multiple than US equities, they are currently trading around six multiple points lower than the US, European earnings growth has accelerated past US earnings growth, and European equities have underperformed US equities by over 25% since the March 23, 2020 pandemic low. A performance catch up is starting to seem more plausible.

Source: Yardeni Research
This chart shows forward Price / Earnings ratios for different regions, using MSCI index data.
3. US growth stocks have staged a performance rebound versus US value stocks. Is the bull market for growth stocks back on track?
US value stocks outperformed US growth stocks for the first five months of the year as an economic activity boom with accelerating inflation was the dominant narrative. However, over the three months ending in August, growth stocks have staged a big comeback. The narrative has started to shift from a fear of inflation to a concern about the sustainable level of revenue growth.

The graph shows the total return for the iShares Russell 1000 Growth ETF (IWF) in orange and the iShares Russell 1000 Value ETF (IWD) in purple for the three months ending in August 2021.
4. While inflation bears monitoring, so does credit risk. Is the compensation for credit risk currently too low?
Of the four questions we have raised, we have the most conviction in answering the last question. Yes, the compensation for credit risk is too low. It might be Bonkers (“The Price Is Right” show has a game by that name). Certainly, the monetary and fiscal stimulus over the last year and a half has boosted economic activity and spared many businesses from more negative outcomes. The US commercial banking system is also in excellent health. The sharp decline in credit spreads from the pandemic highs reflects the uptick in prospects for many non-financial businesses and the strong capital position of the banking system.

Source: St. Louis Federal Reserve Economic Data
This chart shows ICE BoFA High Yield Bond Index credit spreads from December 1996 - August 2021.
However, high yield bond spreads are near the lows of the last 25 years, at a time when interest rates are also near secular lows, debt levels are at a record high for the non-financial business sector, and trend rate of growth of economic activity is lower because productivity has not been able to offset a declining labor participation ratio. While we do not see an immediate cause for the concern, a shock that precipitates a rapid rise in debt costs may not be as manageable for the overall economy as it was in the past. Fragility has increased.