1. Prices for Services excluding Energy and Housing in the Personal Consumption Expenditure metric, a.k.a. Supercore PCE, spiked in January. Was it a blip or an indication of a resurgence in inflationary pressures?
Inflation remains the most important story for markets.
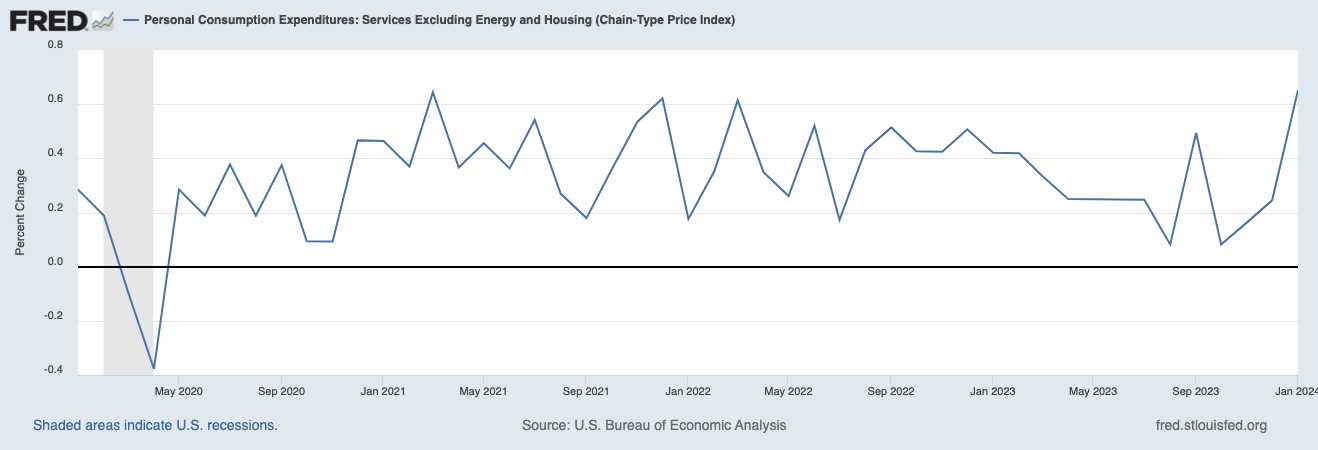
In January, the prices for services excluding energy and housing within personal consumption expenditures jumped 0.6% month over month. It was one of the four highest month over month increases since the beginning of 2021. Services prices have been much stickier than goods prices and represent the risk that the rate of inflation does not return to its 2% pre-pandemic trend.
The Federal Reserve Bank of Atlanta data shows wage growth across all industries continues to slow, but at a gradual rate. Wage growth is to the extent it reflects a virtuous cycle of sustainable economic activity supported by strong productivity growth. However, it still appears much of the wage growth is tied to structural supply shortages in the labor market.
Higher inflation is problematic for investors and financial markets. Not only does higher inflation translate to higher interest rates and borrowing costs, but it also leads to lower multiples and lower investment returns. The last few decades have been a period of low growth in labor costs and low energy costs, both major drivers of rising corporate profit margins.
The rate of inflation peaked in the late summer 2022 but has not retraced its rise on the way down. It appears to have settled above its pre-pandemic range.

The headline inflation rate has dropped to about 1% above pre-pandemic levels but has plateaued in recent months.

The “Core” inflation rate (excludes food and energy) has proven even stickier and remains 2% above pre-pandemic levels.
2. Global equity markets rose sharply in February, led by China, which has been the big laggard over the prior three months.

This chart shows the performance of SPY (SPDR S&P 500 Index ETF in purple), EFA (iShares MSCI EAFE ETF in blue), EEM (iShares MSCI Emerging Markets ETF in orange), IWM (iShares Russell 2000 ETF in grey), and MCHI (iShares MSCI China ETF in red).
Since the end of October 2023, U.S. stocks have sizzled.

This chart shows the performance of SPY (SPDR S&P 500 Index ETF in purple), EFA (iShares MSCI EAFE ETF in blue), EEM (iShares MSCI Emerging Markets ETF in orange), IWM (iShares Russell 2000 ETF in grey), and MCHI (iShares MSCI China ETF in red).
3. In the first two months of 2024, performance of the so-called Magnificent Seven has diverged. It looks more like the Super Four.

This chart shows the performance of NVDA (NVIDIA Corporation in orange), META (Meta Platforms, Inc. in blue), AMZN (Amazon.com, Inc. in yellow), MSFT (Microsoft Corporation in purple), SPY (SPDR S&P 500 Index ETF in grey), GOOGLE (Alphabet Inc. in red), AAPL (Apple Inc. in green), and TSLA (Tesla, Inc. in blue/grey).
Year-to-date, NVDA, META, AMZN, and MSFT have outperformed the S&P 500 Index, while GOOGL, AAPL, and TSLA have underperformed.
4. Treasury yields rose across the curve in February, with the three-year yield experiencing the biggest jump.

Source: www.treasury.gov, Two Centuries Investments
5. Credit markets will likely be the canary in the coal mine, as the typically are, if a sustained economic contraction is forthcoming.
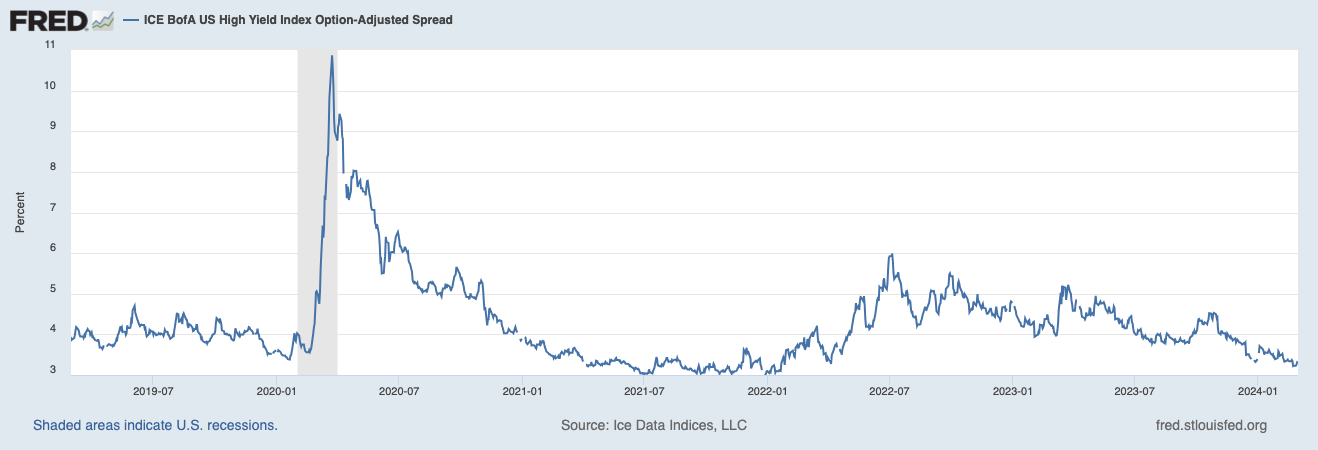
At month end February 2024. high yield bond spreads remained subdued and had settled around 1.5% below long-term averages and well below recent peaks. Good news for sure.