
1. In last month’s letter, we highlighted the breathtaking, parabolic upward movement of some U.S. large-cap stocks. Well, the U.S. equity market (S&P 500 Index) declined by 3.92% in September and many of those high flying stocks performed even worse.
For instance, AAPL declined over 10% in September after rising 103.9% in the prior five months. TSLA declined almost 14% after rising 375.5% over the prior five months. Many of the high flyers have strong underlying business models and associated intangible capital. However, a higher stock price translates to a higher bar (expectation) for future revenue and earnings growth rates. The bar remains high.
2. Credit risk remains ours biggest focus (and biggest concern).
The percentage of bonds rated below investment grade continues to rise. As shown in the chart below, the number of issuers currently rated CCC (“junk” bond is apropos) has markedly exceeded the number of issuers rated CCC during the 2008 Financial Crisis. As we discussed in July’s monthly update (here), credit creation is akin to the arteries in the body’s circulatory system. When the flow weakens too much, the economy will suffer.
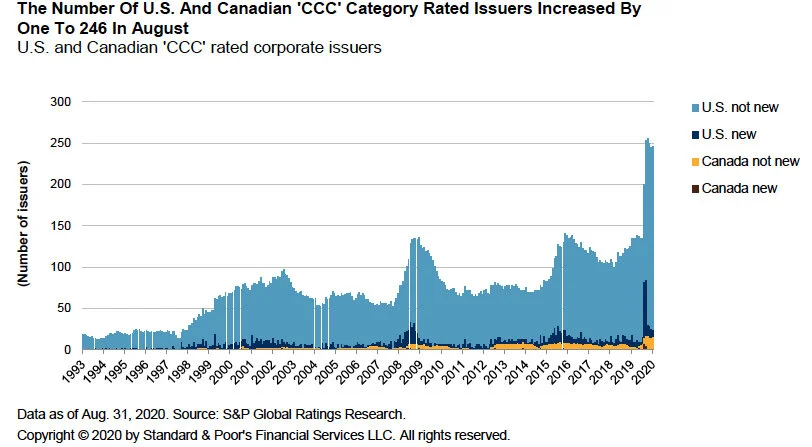
An obligation rated 'CCC' is currently vulnerable to nonpayment and is dependent upon favorable business, financial, and economic conditions for the obligor to meet its financial commitments on the obligation. CCC is three levels below investment grade (BB and B are above it).
3. Interest rates remain low, with essentially no change in rates in September. The conclusion remains the same, namely it is difficult for businesses and individuals to generate interest income.
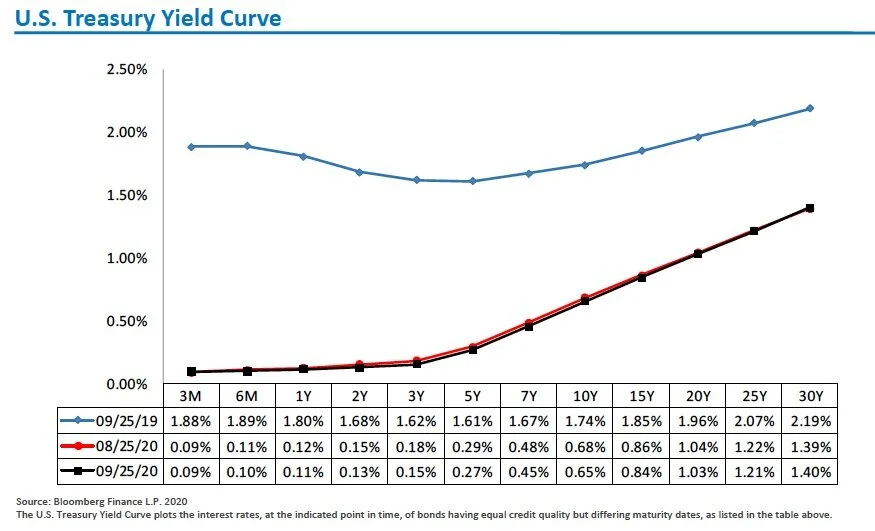
Source: DoubleLine
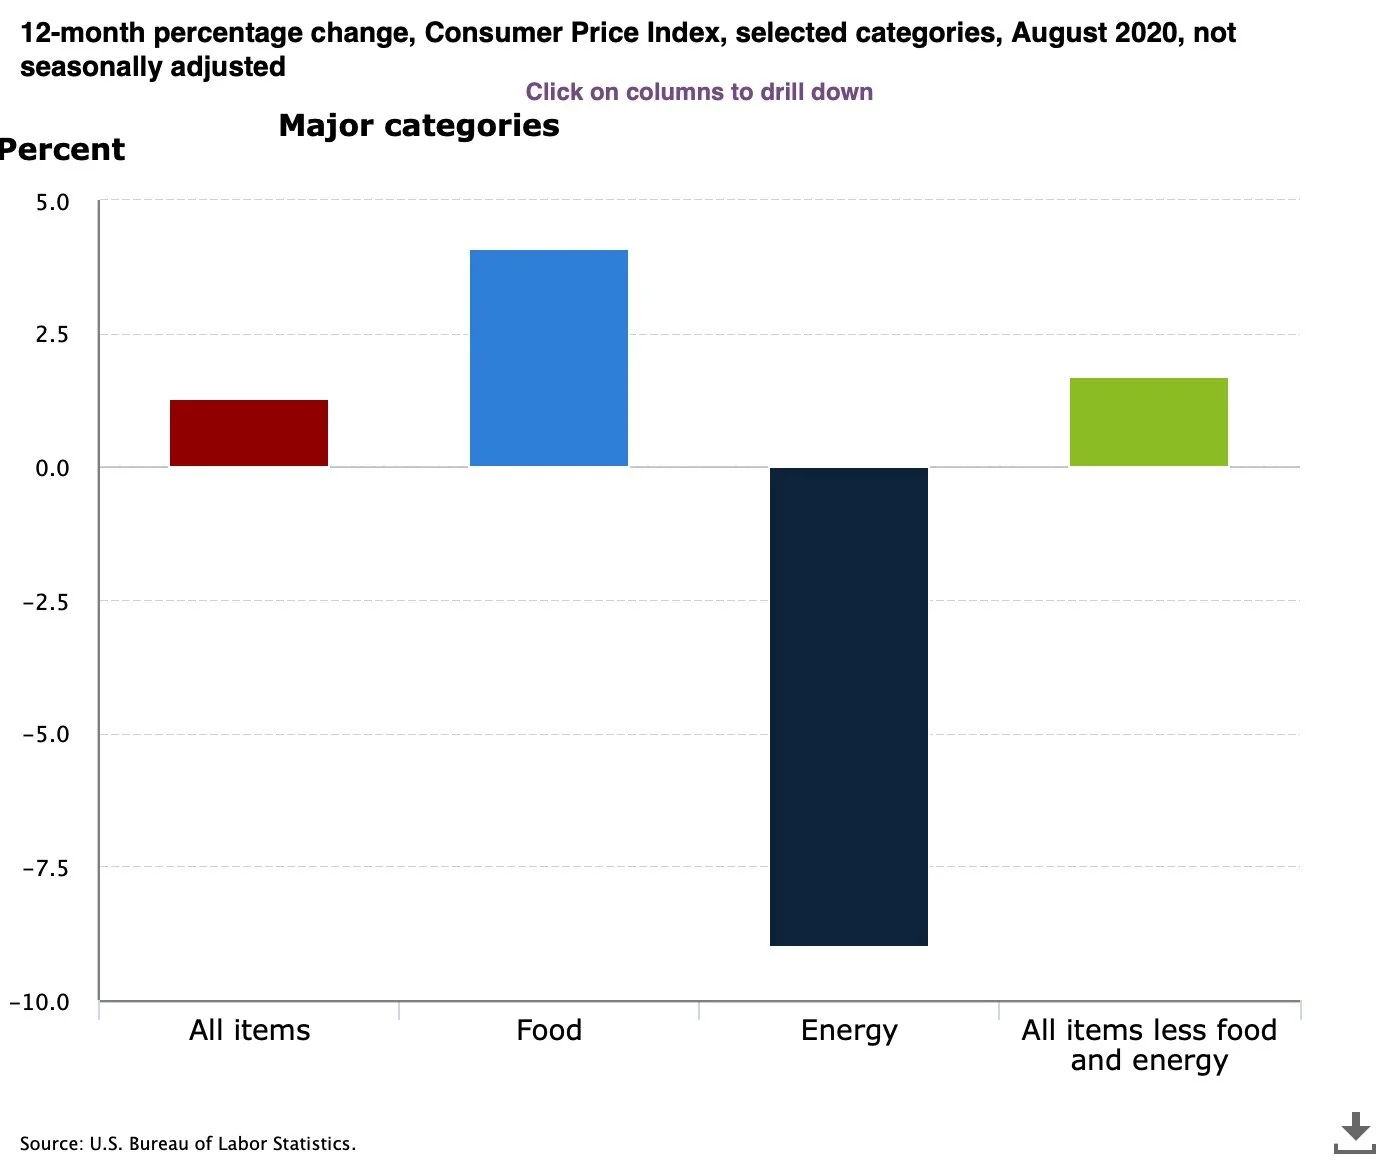
4. We remain sanguine about inflation in the near-term. A credit crisis or major supply shock is likely to precede a sustained, higher level of inflation.
My colleague Mikhail Samonov’s recent blog post (here) discusses our thought process on inflation. We remain vigilant as inflation can accelerate suddenly and often follows a non-linear path. Thus far, the COVID-19 related shock to supply chain has only shown up in food prices.
5. The Presidential and Congressional elections are a month away. Yes, the presidential candidates differ markedly on economic policy. However, details of proposed policies have been sparse. Plus, control of the Senate is still up in the air. In summary, it is difficult to discern the impact for stocks.
That said, a few significant economic policy differences stand out. First, President Trump has demonstrated a distrust of globalization. If he wins a second term, we expect an even more restrictive trade policy, a headwind for multi-national companies. The greatest risk may be for consumer oriented companies with both customer and supply chain exposure in China.
On the other hand, a Biden administration would likely reverse the direction taken by the Trump administration in two areas, namely business regulations and taxes. Higher regulations and higher business taxes would weigh on corporate profit margins. We would also expect the Biden administration to attempt to raise taxes on individuals. Unless the administration provides a large fiscal stimulus at the same time, the hit to both revenues and profit margins will be damaging to corporate profitability and, by extension, stock prices.
A Biden administration would incentivize higher usage of renewable energy, a big positive for solar companies and an incremental negative for fossil fuel companies. However, solar company stocks are currently pricing in lots of good news and oil exploration & production stocks are pricing in bad news. If Biden wins, what will matter for these energy company stocks is not what a Biden administration does, but what it does relative to the expectations already priced into the stocks.
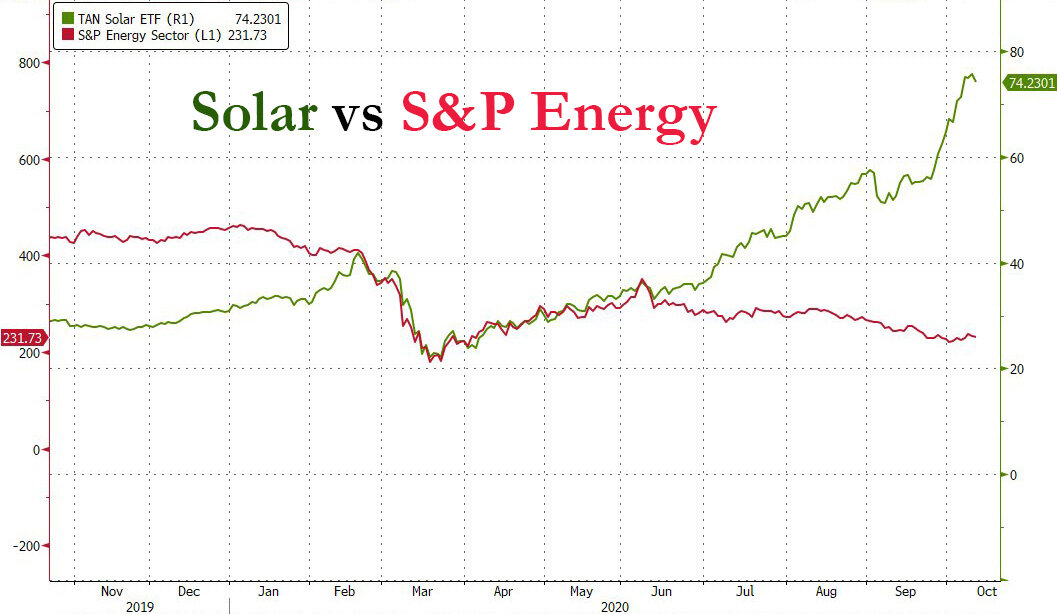
This graph shows the outperformance since June 2020 of the Invesco Solar ETF (TAN) relative to.the S&P Energy Index.