Fundamental Investing

December 2023 Market Update: That De-Escalated Quickly

“That escalated quickly” is a phrase uttered by Ron Burgundy in the 2004 movie, Anchorman: The Legend of Ron Burgundy. By “that de-escalated quickly”, we mean the burgeoning U.S. Treasury bond market crisis de-escalted quickly in November.

1. Global equity markets rebounded after three months of declines, boosted by the sharp reversal in U.S. long-term Treasury bond yields.

This chart shows the performance of SPY (SPDR S&P 500 Index ETF in purple), EFA (iShares MSCI EAFE ETF in blue), EEM (iShares MSCI Emerging Markets ETF in orange) and IWM (iShares Russell 2000 ETF in grey), and TLT (iShares 20+ Year Treasury Bond ETF in dashed green).

2. The burgeoning Treasury bond market crisis de-escalated quickly. The bear steepening ceased after three and half months, and long matured Treasury yields declined sharply, approaching the levels of August month end.

Source: www.treasury.gov, Two Centuries Investments

A bear steepening is commonly defined as a double-digit basis point increase in the difference between the 10-year Treasury and 2-year Treasury yield. A bear steepening is a rare occurrence, especially when the yield curve is inverted like it is currently.

The table below from Janus Henderson illustrates the historical rarity.

·       The orange highlighted rows map to bear steepening off inverted yield curves.

·       The blue highlighted rows map to bear steepening off relatively flat curves.

·       The green highlighted rows map to bear steepening off very steep curves.

Our hypothesis remains the bond market was likely communicating a supply digestion concern. We are not certain the supply digestion problem is fully resolved. However, in November the bond market took notice of the continuing moderation of inflation and a downtrend in real economic growth. Odds increased the FOMC will cut the Federal Funds Rate multiple times in 2024.

3. As we keep repeating, what lies ahead for financial markets will likely be driven by the path and composition of inflation.

The concern about inflation has likely contributed to the bear steepening of the yield curve. Inflation has historically impacted equity valuation multiples. High inflation has led to lower multiples and thus lower investment returns. The composition of inflation will also impact earnings. The last few decades have been a period of low growth in labor costs and low energy costs, both major drivers of rising corporate profit margins.

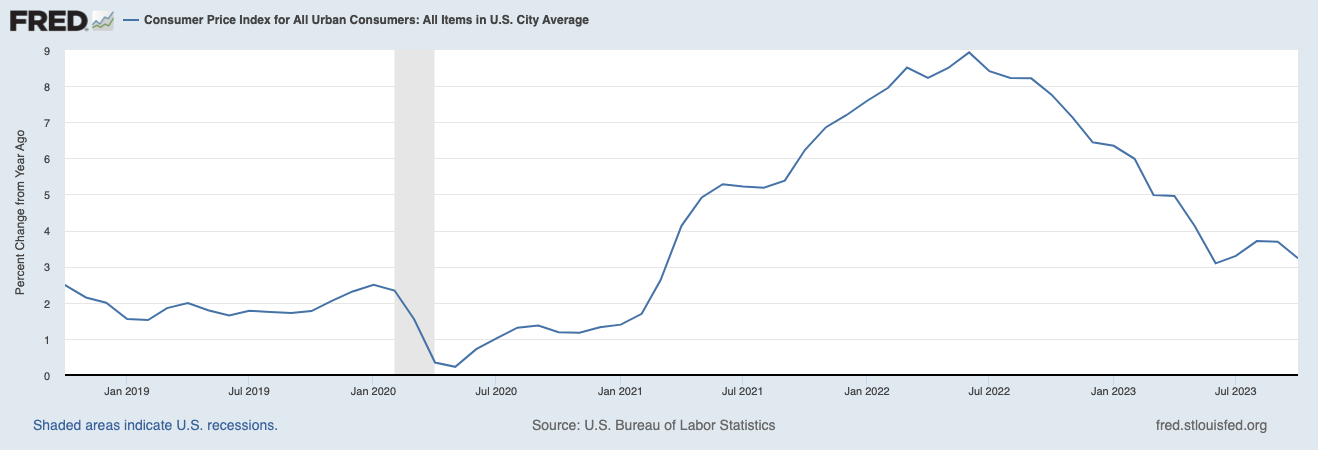
The headline inflation rate has dropped to about 1% above pre-pandemic levels but has risen over the last three months.

The concern is the “core” inflation rate (excludes food and energy) has proven stickier and remains 2% above pre-pandemic levels.

4. Despite the Federal Reserve raising the federal funds rate by 5% over the last eighteen months, real economic growth has not collapsed, though it remains muted.

Real gross domestic product (GDP) and real gross domestic income (GDI) have diverged over the last few quarters. GDP data shows the economy humming along, while GDI data  points to an economic slowdown.

5. The challenge the Federal Reserve faces is how to balance its dual mandate of maximum employment and stable (2% target) inflation.

In the current economic environment. the Federal Reserve cannot achieve its inflation target without risking a significant rise in unemployment and a recession. Because of structural supply shortages, most notably in the labor market, tighter monetary policy is less effective in reducing inflationary pressures. Tighter monetary policy operates by increasing the cost of debt capital and thus, with a lag, puts downward pressure on the demand for goods and services. The dilemma is the Federal Reserve may have to risk crushing real GDP growth (the volume of goods and services being transacted) in order to crush inflationary pressures (price of goods and services being transacted).

While the Federal Reserve Bank of Atlanta data shows wage growth across all industries continues to slow, there are many industries facing supply shortages. Over the last several months, United Airlines and American Airlines pilots were able to negotiate 40% wage increases over the next four years. UPS union employees negotiated wage increases near 20% over five years and the UAW (United Auto Workers) negotiated 25% general pay increases plus cost-of-living adjustments over the next four years for the Big 3 auto workers.

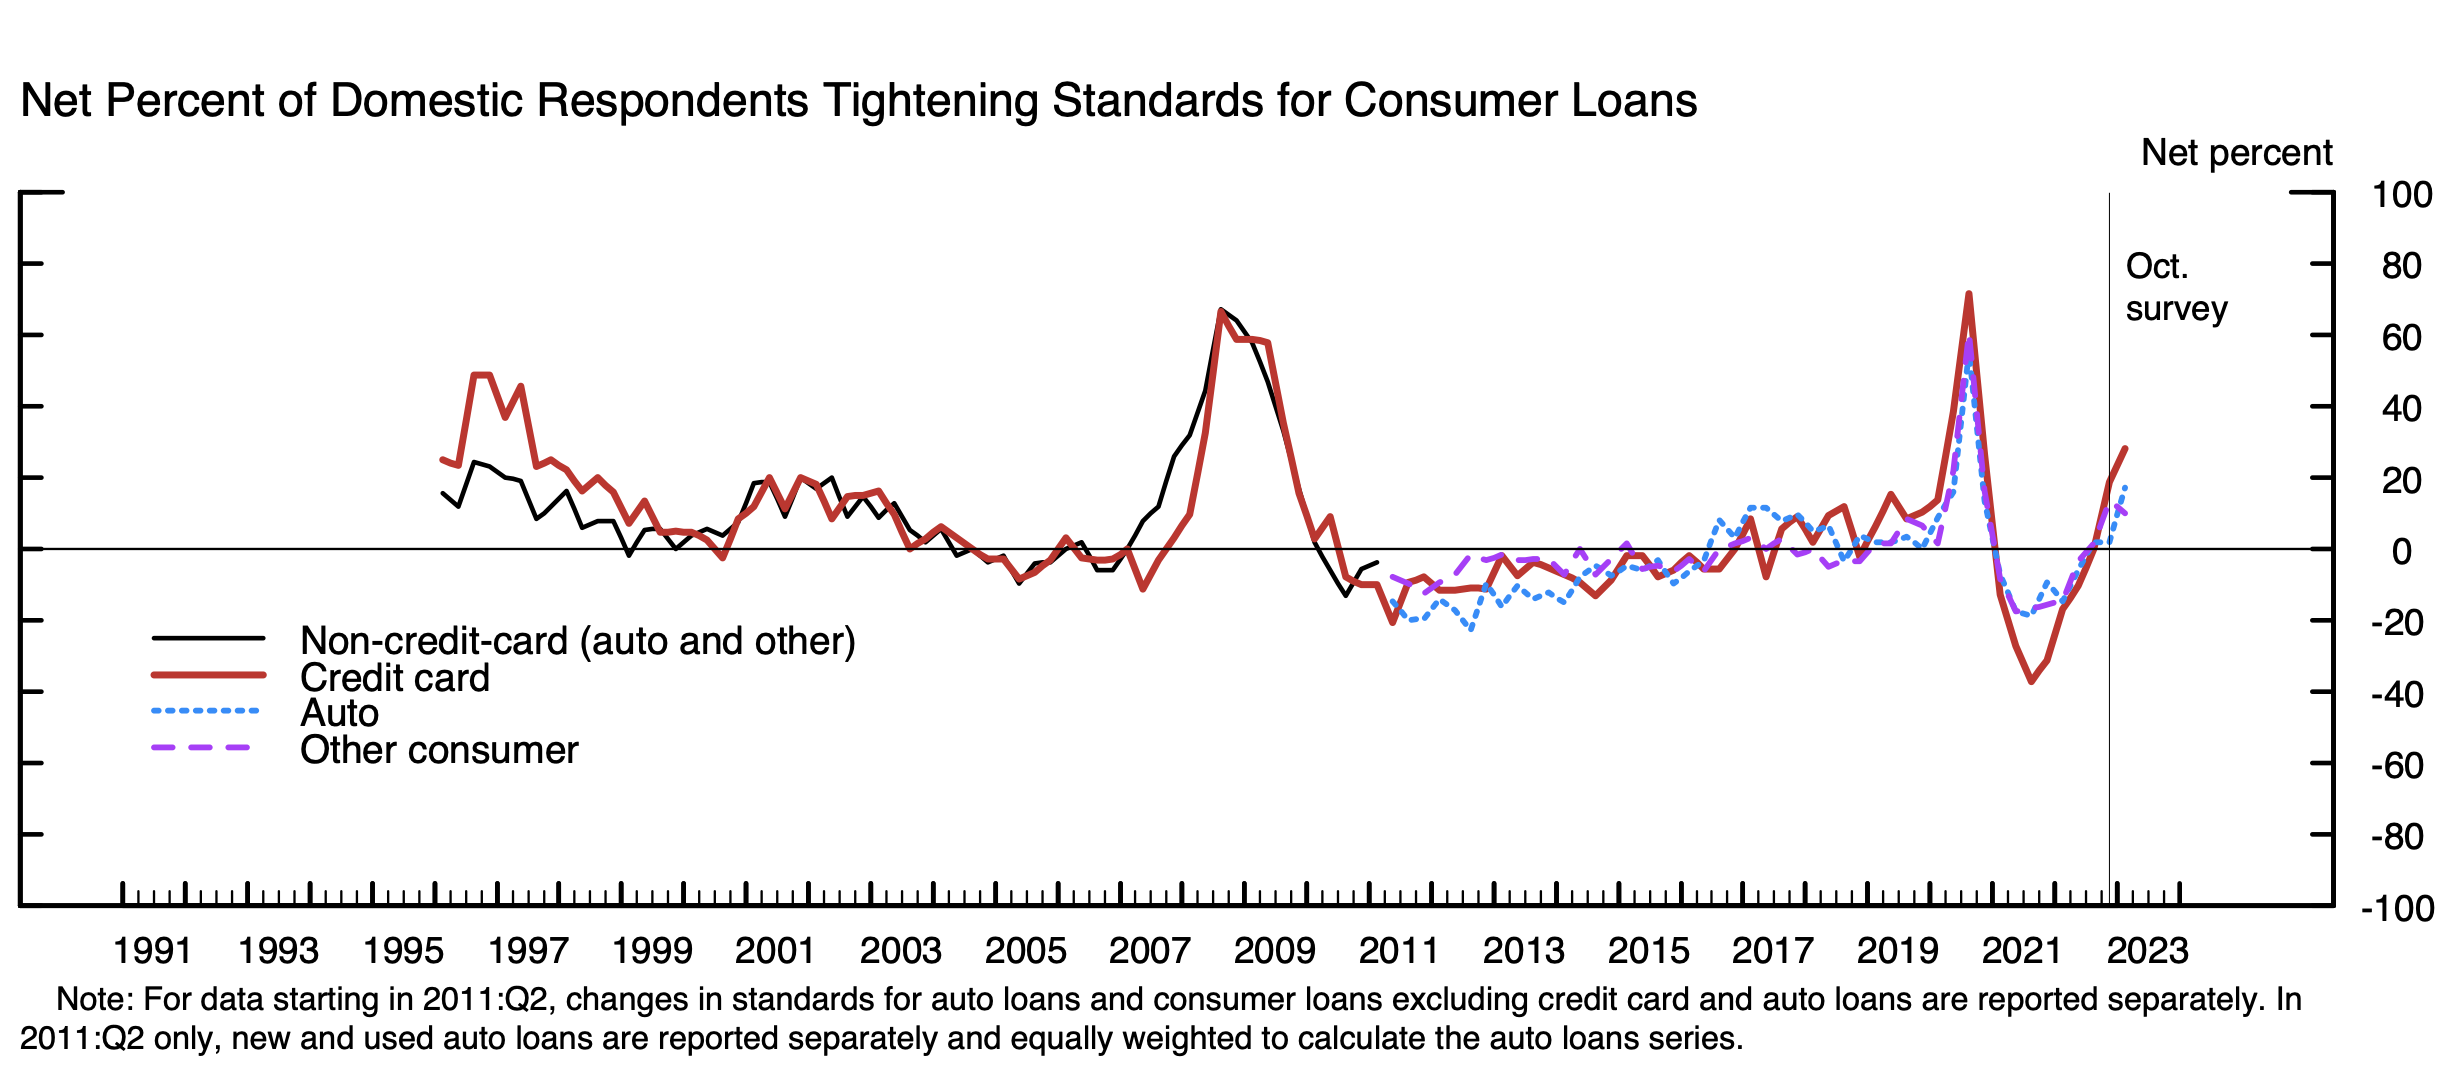
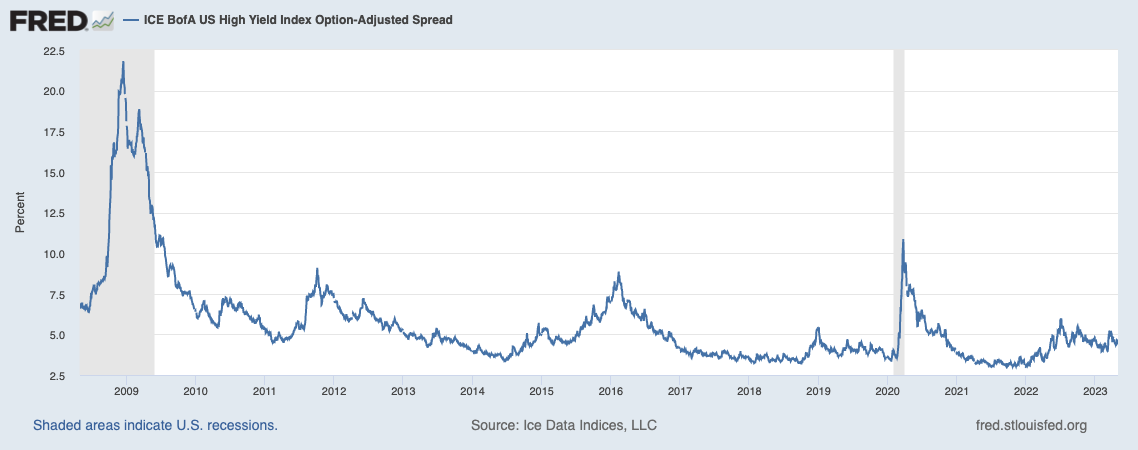
6. Credit markets remain sanguine despite the Federal Reserve’s actions to tighten monetary policy and the multi-month bear steepening of the yield curve.

7. Over the last two months, one of the best performing asset classes has been gold, which traded at all time highs recently and currently sits at over $2,000 per ounce.

This chart shows the performance of SPY (SPDR S&P 500 Index ETF in purple), EFA (iShares MSCI EAFE ETF in blue), EEM (iShares MSCI Emerging Markets ETF in orange) and IWM (iShares Russell 2000 ETF in grey), and GLD (SPDR Gold Trust in dashed gold).

July 2023 Market Update: Strong Equity Rebound Continues...What Lies Ahead?

1. June was a strong month for the U.S. equity market.

This chart shows the performance of SPY (SPDR S&P 500 Index ETF in purple), EFA (iShares MSCI EAFE ETF in blue), EEM (iShares MSCI Emerging Markets ETF in orange) and IWM (iShares Russell 2000 ETF in green).

In June, U.S. equity markets outperformed non-US equity markets. U.S. small cap stocks outperformed U.S. large cap stocks after lagging their larger cap peers since the regional bank crisis in March.

2. Year-to-date trends remain intact, with large cap U.S. equities leading the way and emerging market equities as the laggard, dragged down by China.

This chart shows the performance of SPY (SPDR S&P 500 Index ETF in purple), EFA (iShares MSCI EAFE ETF in blue), EEM (iShares MSCI Emerging Markets ETF in orange) and IWM (iShares Russell 2000 ETF in green).

3. The powerful rally in U.S. growth stocks has propelled the U.S. equity market.

This chart shows the performance of SPY (SPDR S&P 500 Index ETF in purple), IWF (iShares Russell 1000 Growth ETF in blue), IWD (iShares Russell 1000 Value ETF in orange).

Year-to-date, U.S. large cap growth stock universe has generated a 30% return.

4. Year-to-date, other asset classes have provided modest returns.

This chart shows the performance of SPY (SPDR S&P 500 Index ETF in purple), IWM (iShares Russell 2000 ETF in green), HYG (iShares iBoxx USD High Yield Corporate Bond ETF in blue), GLD (SPDR Gold Trust ETF in yellow), and TLT (iShares 20+ Year Treasury Bond ETF in orange).

5. An examination of performance over the last 18 months is a sober reminder financial markets have not fully recovered from the carnage of the first nine months of 2022.

This chart shows the performance of SPY (SPDR S&P 500 Index ETF in purple), IWM (iShares Russell 2000 ETF in green), HYG (iShares iBoxx USD High Yield Corporate Bond ETF in blue), GLD (SPDR Gold Trust ETF in yellow), aTLT (iShares 20+ Year Treasury Bond ETF in orange), IWF (iShares Russell 1000 Growth ETF in red), IWD (iShares Russell 1000 Value ETF in gray).

6. What lies ahead for financial markets will be likely be driven by the path and composition of inflation.

The level of inflation has historically impacted equity valuation multiples. High inflation (and deflation) has led to lower multiples and thus lower investment returns. The composition of inflation will also impact earnings. The last few decades have been a period of low growth in labor costs, thus boosting corporate profit margins.

Producer prices have already declined back to pre-pandemic levels.

Consumer prices have continued to decline but remain around 2% above pre-pandemic levels.

Wage growth remains strong in many segments of the labor market. The stickiness of higher wage growth remains a headwind to profit margins.

7. Global trade volumes are declining and manufacturing surveys point ot continued weakness.

Source: John Kemp (Reuters)

8. Corporate earnings reports for the second quarter are just around the corner. The results and management commentary will provide some clarity on the economic outlook, now that the pandemic related distortion of economic collapse / economic surge / economic normalization is entering the rear view mirror.

The results from early reporter FedEx Corp. (ticker: FDX) were not reassuring. All three FedEx segments (Express, Ground, Freight) experienced volume declines and management is forecasting “flat to low-single-digit-percent revenue growth year over year” for fiscal year 2024.

9. While manufacturing and global trade exhibit sustained weakness, consumer spending on services and most of the service sector have chugged along.

What could disrupt this consumer momentum, outside of the obvious job losses, which is a lagging indicator?

(1) Refinancing risk for loans, especially mortgages, either in the form of higher interest rates (compared to 2021) and tighter bank lending standards, likely driven by the aftershocks of the March 2023 regional bank crisis.

Source: treasury.gov, Two Centuries Investments

(2) Higher energy prices, namely higher crude oil prices.

Source: John Kemp (Reuters)

Crude oil prices remain well below the recent 2022 peak.

May 2023 Market Update: Bank Stress Takes the Front Page from Inflation

1. Despite the failure of a third large U.S. bank, the U.S. equity market rose in April.

This chart shows the price performance of SPY (SPDR S&P 500 Index ETF in blue), EFA (iShares MSCI EAFE ETF in purple), and EEM (iShares MSCI Emerging Markets ETF in orange).

2. April continued the year-to-date trend of non-US developed market equities leading the way higher, while emerging market equities continue to lag.

This chart shows the price performance of SPY (SPDR S&P 500 Index ETF in blue), EFA (iShares MSCI EAFE ETF in purple), and EEM (iShares MSCI Emerging Markets ETF in orange).

3. While the US equity market has risen almost 10% year-to-date though the end of April, there has been massive performance dispersion within the market.

This chart shows the price performance of SPY (SPDR S&P 500 Index ETF in blue), XLK (Technology Select Sector SPDR ETF in green), and KRE (SPDR S&P Regional Banking ETF in red).

Technology stock prices have bounced higher, with the sector generating a year-to-date return in excess of 20%. On the other hand, the bank crisis has crushed regional bank stocks, which have crashed by more than 25% year-to-date through the end of April.

4. The regional bank crisis has yet to be resolved, highlighted by the failure of First Republic Bank and its sale at a discounted valuation to JP Morgan Chase & Company.

First Republic Bank was a large regional bank, with $165 billion in deposits as of December 31, 2022.

As we noted in last month’s update, over a two-year period ending in early 2022, many banks experienced rapid balance sheet growth due to an influx of deposits. The banks invested the deposits to earn higher interest income, but took significant interest rate risk in the process. In 2022, the spike in interest rates across the yield curve led to unrealized losses on securities and loans and reduced the capital (solvency) of most banks.

Adding to the solvency concerns for regional banks is rising delinquencies for commercial real estate loans, especially office and retail loans.

On the other side of the balance sheet, the spike in short term interest rates exposes the banks to disintermediation (deposits being withdrawn and moved to money market funds) and to higher funding costs to replace lost deposits. Together, these factors reduce the future net interest income (earnings) needed to replenish the capital.

Worst of all is uninsured depositors who travel in the same personal and professional circles. Silicon Valley Bank (SVB) and First Republic Bank (FRB) had well above average exposure to these “hot money” depositors.

Not only aren’t they “sticky” depositors, they don’t act independently and their behavior is highly correlated. Their risk profile is reminiscent of the subprime borrowers of the 2008 Global Financial Crisis, a group whose default behavior was highly correlated once stress hit the financial system.

Once these depositors initiated large and rapid deposits withdrawals, the fates of SVB and FRB were sealed. Selling a large percentage of assets with unrealized losses crystallizes insolvency. Replacing a large percentage of existing deposit funding, even with Federal Home Loan Bank (FHLB) secured borrowing available, is near impossible and will result in negative earnings for the near term as funding costs will exceed interest on assets.

The chart below, from Moody’s Analytics, shows the banking system funding stress has reached 2008 Global Financial Crisis levels.

The chart below shows the build up of deposits in smaller banks during the pandemic, driven by the massive government stimulus programs, and the recent accelerated decline.

5. Even if the bank crisis gets resolved in the near term, the events of March and April will lead to risk aversion by many banks. Combined with rising credit provisions, banks will continue to tighten lending standards, creating a headwind for economic growth.

Source: federalreserve.gov

Source: federalreserve.gov

According to the Federal Reserve’s Senior Loan Officer Opinion Survey on Bank Lending Practices, banks have been tightening lending standards on loans since July 2022.

The tightening of credit standards is running into increased demand for loans from U.S. consumers.

6. The bank funding stress has yet to show up in the high yield debt market as credit spreads remain quite muted relative to prior recessions and crises.

7. Corporate earnings season confirmed businesses are still dealing with cost pressures, though the pressure is moderating.

With 85% of S&P 500 companies having reported earnings, year over year revenue growth was a modest 3.9%. However, earnings declined 2.2%, though less than the 4.6% decline in the prior quarter. Operating profit margins are below their recent peak, and have stopped their rapid decline. With companies facing moderating top line growth and a higher cost of capital, the path of profit margins will assume increased importance.